New: NextGenTemplates Academy - video courses on Excel formulas with AI and Pivot Tables & dashboards. Early-bird: 20% off with code EARLYBIRD20 - first 20 orders only. See the courses →
  • Learn Excel (Free Course)
    • 1. Shortcut Keys
    • 2. Fill & Flash Fill
    • 3. Find & Replace
    • 4. Sort & Filter
    • 5. Formulas & Functions
    • 6. Data Validation
    • 7. Conditional Formatting
    • 8. Basic Charts
    • 9. Advanced Charts
    • 10. Pivot Tables
    • 11. Excel Dashboards
    • 12. VBA Course
    • 13. Excel Formulas with AI
  • Templates
  • Tutorials
    • Charts and Visualization
    • VBA
    • Excel Tips and Tricks
    • Excel Dashboards
    • Power Pivot & DAX
  • Power BI
  • Template Store
    • Ready to Use Templates
  • Courses
  • Academy
    • Excel + AI Mastery: 100 Formulas
    • Excel Pivot Tables & Dashboards
  • About Us
  • Contact Us

PK: An Excel Expert

Transforming Data into Decisions

Tag: Finance Dashboard Power BI

Power Pivot

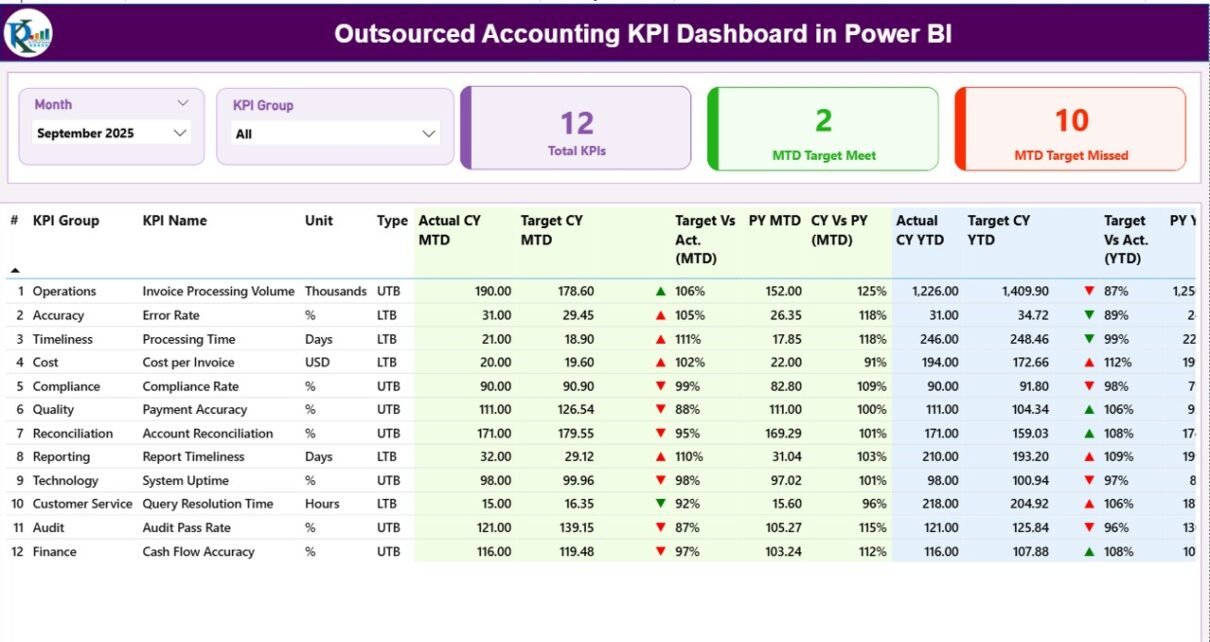
Outsourced Accounting KPI Dashboard in Power BI

March 10, 2026March 10, 2026 PKComments Off on Outsourced Accounting KPI Dashboard in Power BI
Managing outsourced accounting services requires accurate performance tracking, transparency, and data-driven decision making. However, many organizations still rely on scattered spreadsheets and manual reporting. As a result, managers struggle to
Read More
Dashboard Power BI

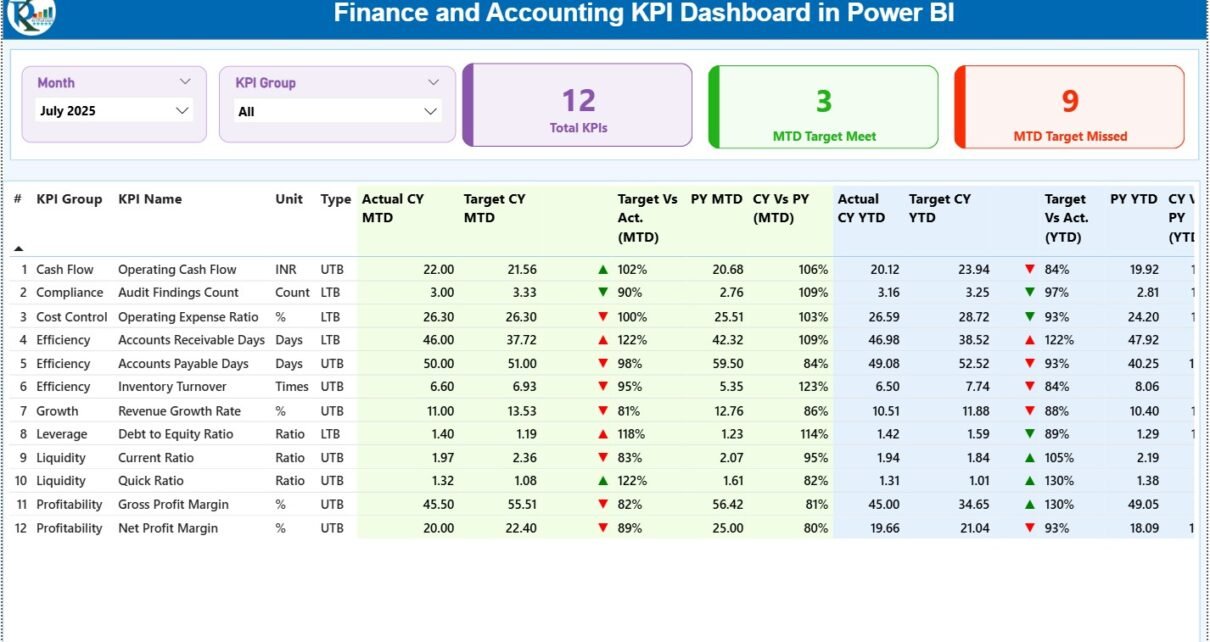
Finance and Accounting KPI Dashboard in Power BI

January 14, 2026January 14, 2026 PKComments Off on Finance and Accounting KPI Dashboard in Power BI
Managing finance and accounting performance has become more complex than ever. Every organization needs real-time visibility into revenue, costs, profitability, and efficiency. However, many finance teams still depend on static
Read More
Dashboard Power BI

Treasury Management KPI Dashboard in Power BI

January 2, 2026January 2, 2026 PKComments Off on Treasury Management KPI Dashboard in Power BI
In today’s fast-moving financial environment, treasury teams must make decisions quickly and accurately. However, when cash positions, liquidity data, funding metrics, and risk indicators remain scattered across spreadsheets, decision-making becomes
Read More
Dashboard Power BI

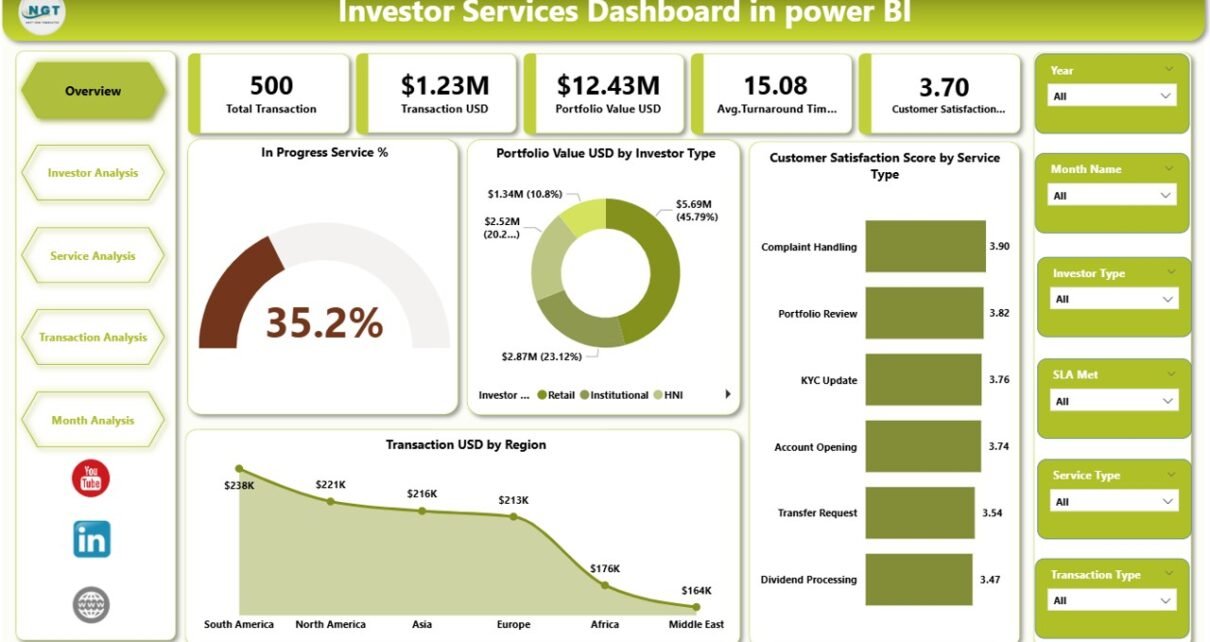
Investor Services Dashboard in power BI

December 16, 2025December 16, 2025 PKComments Off on Investor Services Dashboard in power BI
Managing investor services without a centralized performance view often leads to delayed decisions, missed opportunities, and dissatisfied investors. However, when organizations adopt an Investor Services Dashboard in Power BI, they
Read More
  • Learn Excel (Free Course)
    • 1. Shortcut Keys
    • 2. Fill & Flash Fill
    • 3. Find & Replace
    • 4. Sort & Filter
    • 5. Formulas & Functions
    • 6. Data Validation
    • 7. Conditional Formatting
    • 8. Basic Charts
    • 9. Advanced Charts
    • 10. Pivot Tables
    • 11. Excel Dashboards
    • 12. VBA Course
    • 13. Excel Formulas with AI
  • Templates
  • Tutorials
    • Charts and Visualization
    • VBA
    • Excel Tips and Tricks
    • Excel Dashboards
    • Power Pivot & DAX
  • Power BI
  • Template Store
    • Ready to Use Templates
  • Courses
  • Academy
    • Excel + AI Mastery: 100 Formulas
    • Excel Pivot Tables & Dashboards
  • About Us
  • Contact Us
Copyright © 2023 PK-AnExcelExpert.com - Privacy Policy