New: NextGenTemplates Academy - video courses on Excel formulas with AI and Pivot Tables & dashboards. Early-bird: 20% off with code EARLYBIRD20 - first 20 orders only. See the courses →
  • Learn Excel (Free Course)
    • 1. Shortcut Keys
    • 2. Fill & Flash Fill
    • 3. Find & Replace
    • 4. Sort & Filter
    • 5. Formulas & Functions
    • 6. Data Validation
    • 7. Conditional Formatting
    • 8. Basic Charts
    • 9. Advanced Charts
    • 10. Pivot Tables
    • 11. Excel Dashboards
    • 12. VBA Course
    • 13. Excel Formulas with AI
  • Templates
  • Tutorials
    • Charts and Visualization
    • VBA
    • Excel Tips and Tricks
    • Excel Dashboards
    • Power Pivot & DAX
  • Power BI
  • Template Store
    • Ready to Use Templates
  • Courses
  • Academy
    • Excel + AI Mastery: 100 Formulas
    • Excel Pivot Tables & Dashboards
  • About Us
  • Contact Us

PK: An Excel Expert

Transforming Data into Decisions

Tag: financial analytics

Dashboard Power BI

Derivatives Trading Dashboard in Power BI

January 5, 2026January 5, 2026 PKComments Off on Derivatives Trading Dashboard in Power BI
Derivatives trading continues to grow rapidly across global financial markets. As trading volumes increase, complexity also rises. Therefore, trading desks, risk managers, and finance leaders need clear visibility into positions,
Read More
Dashboard Power BI

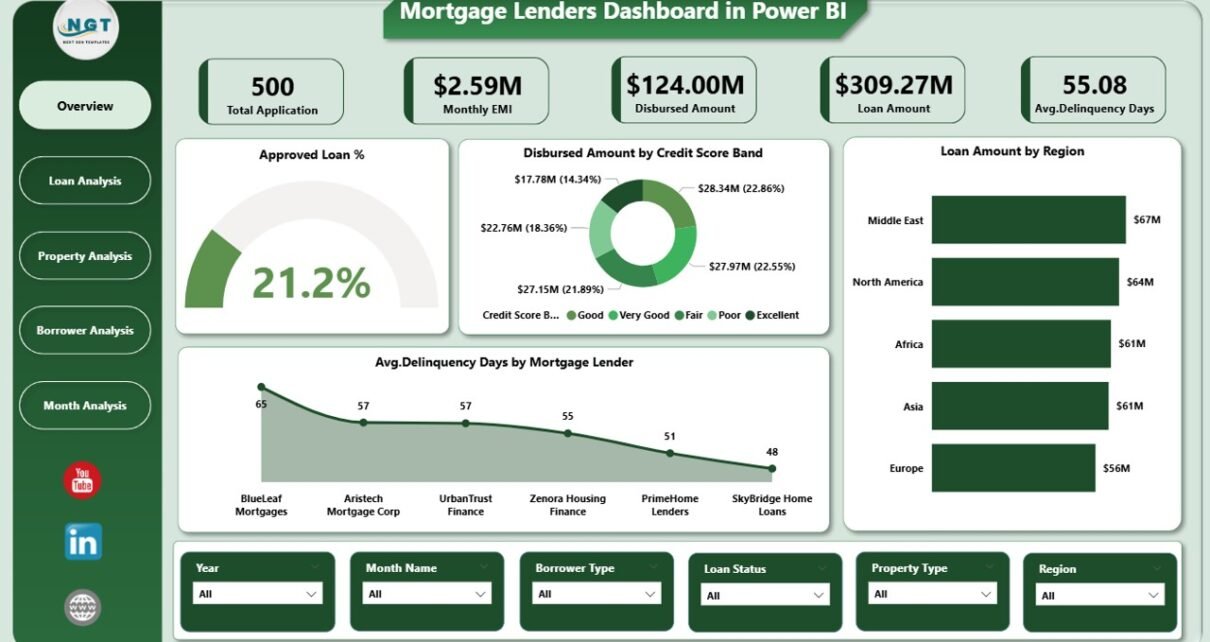
Mortgage Lenders Dashboard in Power BI

January 2, 2026January 2, 2026 PKComments Off on Mortgage Lenders Dashboard in Power BI
In today’s fast-moving mortgage industry, lenders must act quickly and accurately. However, when loan data stays scattered across spreadsheets, systems, and reports, decision-making slows down. As a result, lenders struggle
Read More
Dashboard

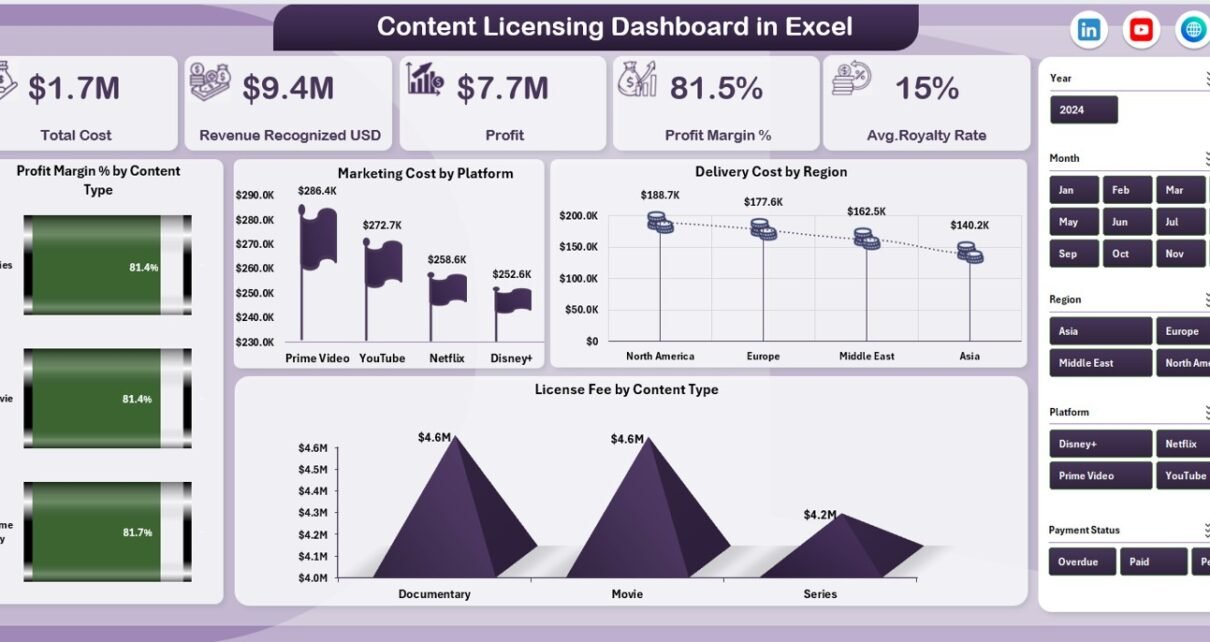
Content Licensing Dashboard in Excel

December 30, 2025December 30, 2025 PKComments Off on Content Licensing Dashboard in Excel
Managing content licensing is no longer a simple accounting task. Today, media companies, publishers, OTT platforms, digital agencies, and content aggregators deal with multiple content types, platforms, regions, royalty structures,
Read More
Dashboard

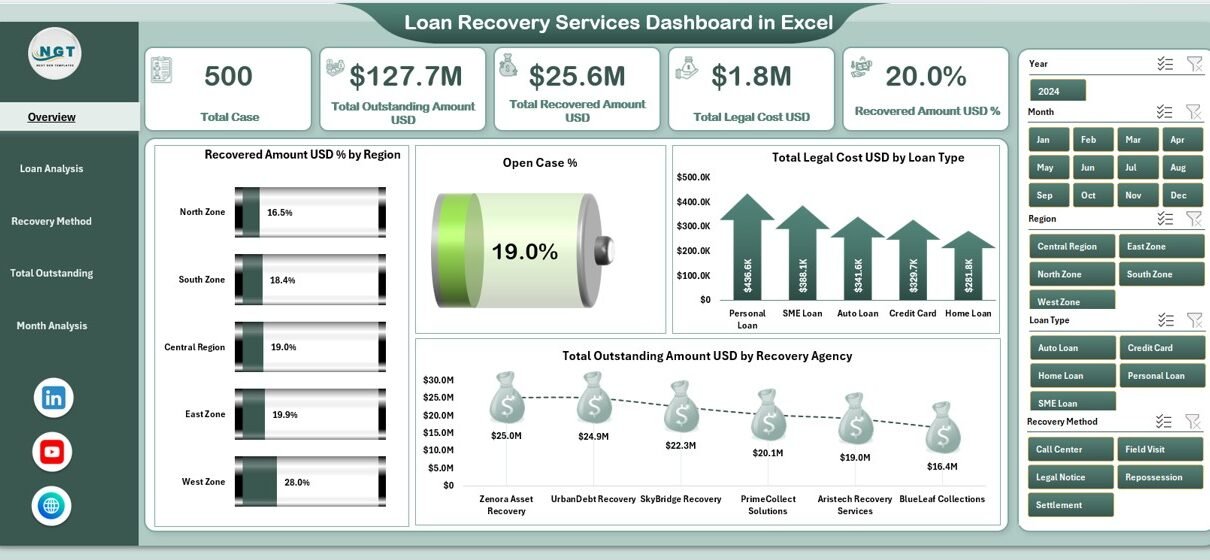
Loan Recovery Services Dashboard in Excel

December 16, 2025December 18, 2025 PKComments Off on Loan Recovery Services Dashboard in Excel
Managing loan recovery without proper visibility often creates delays, higher costs, and lower recovery rates. However, when financial institutions rely only on scattered spreadsheets or manual reports, decision-making becomes slow
Read More
Dashboard Power BI

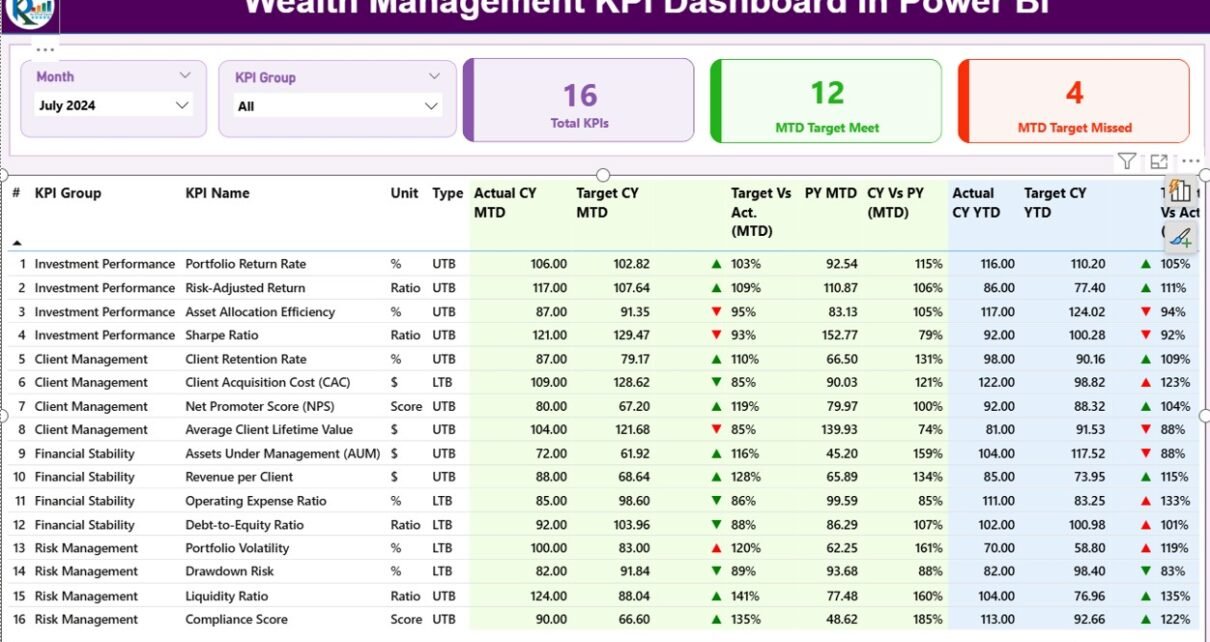
Wealth Management KPI Dashboard in Power BI

December 9, 2025December 9, 2025 PKComments Off on Wealth Management KPI Dashboard in Power BI
A Wealth Management KPI Dashboard in Power BI is a ready-to-use, interactive performance monitoring tool designed specifically for wealth managers, investment firms, private banks, and financial advisors. It helps decision-makers
Read More
Dashboard

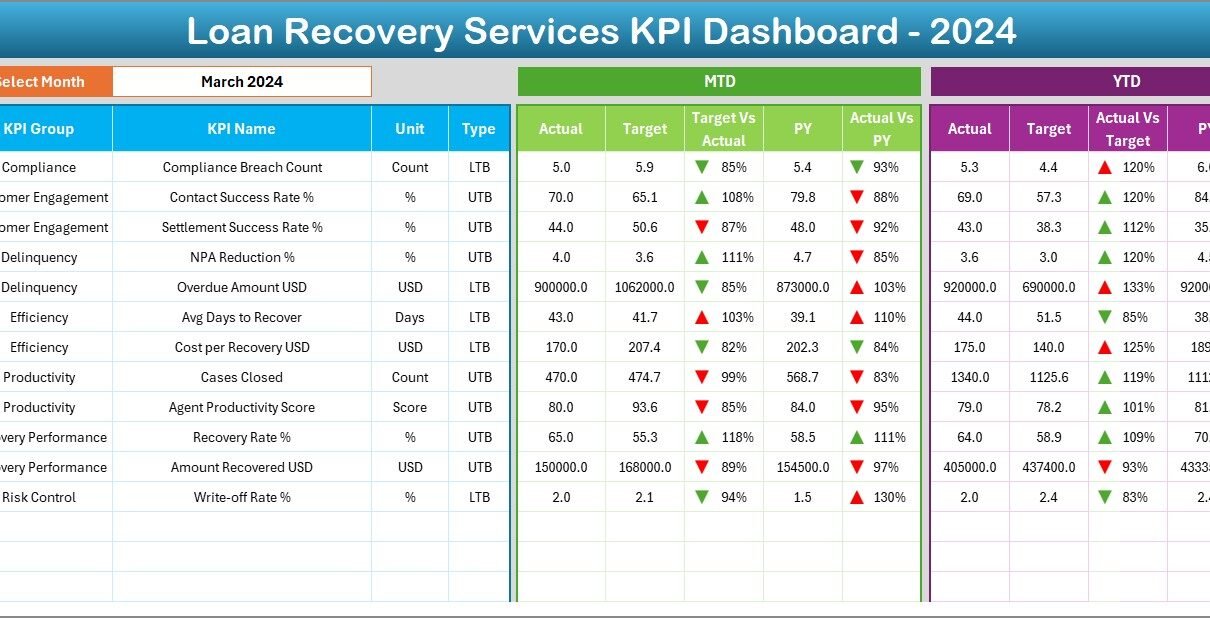
Loan Recovery Services KPI Dashboard in Excel

December 8, 2025December 8, 2025 PKComments Off on Loan Recovery Services KPI Dashboard in Excel
Loan recovery plays a critical role in the financial health of banks, NBFCs, microfinance institutions, and lending companies. However, managing recovery performance without a structured monitoring system often leads to
Read More
Power BI

Stock Exchanges KPI Dashboard in Power BI

December 7, 2025December 7, 2025 PKComments Off on Stock Exchanges KPI Dashboard in Power BI
In today’s fast-moving financial markets, stock exchanges generate massive volumes of data every single day. However, numbers alone do not create clarity. To stay competitive, exchanges, regulators, analysts, and leadership
Read More
Dashboard Power BI

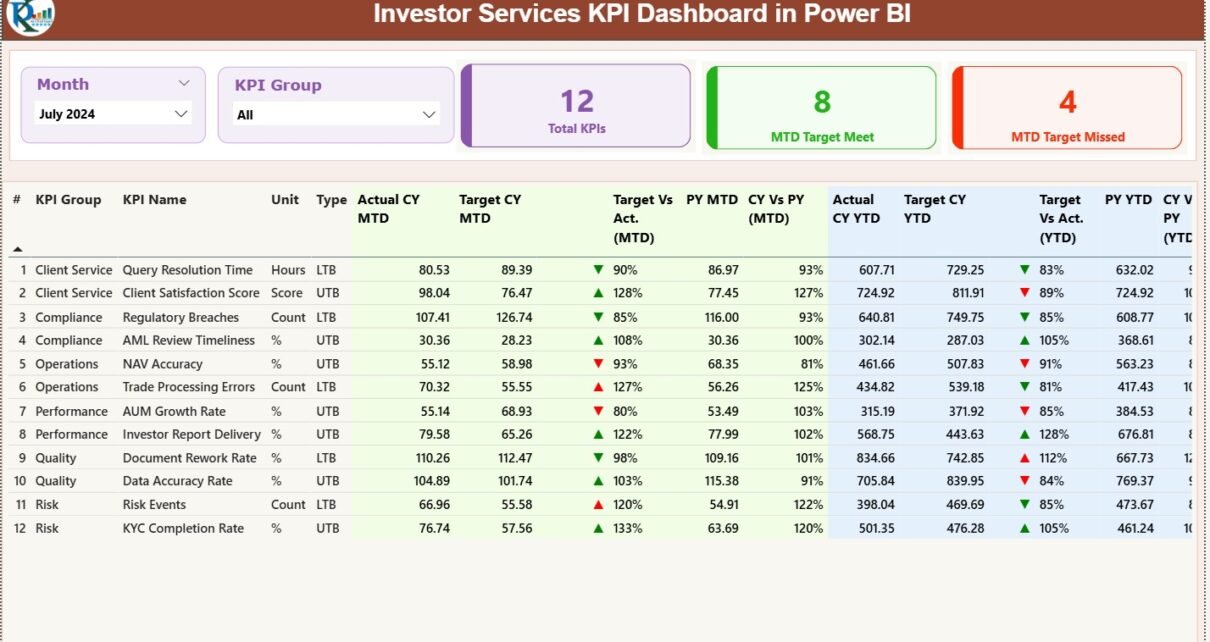
Investor Services KPI Dashboard in Power BI

December 5, 2025December 5, 2025 PKComments Off on Investor Services KPI Dashboard in Power BI
Investor services teams work in a fast and demanding environment. They handle investor onboarding, communication, fund reporting, compliance reviews, performance updates, and service-level commitments every day. Because investors expect transparency
Read More
Dashboard Power BI

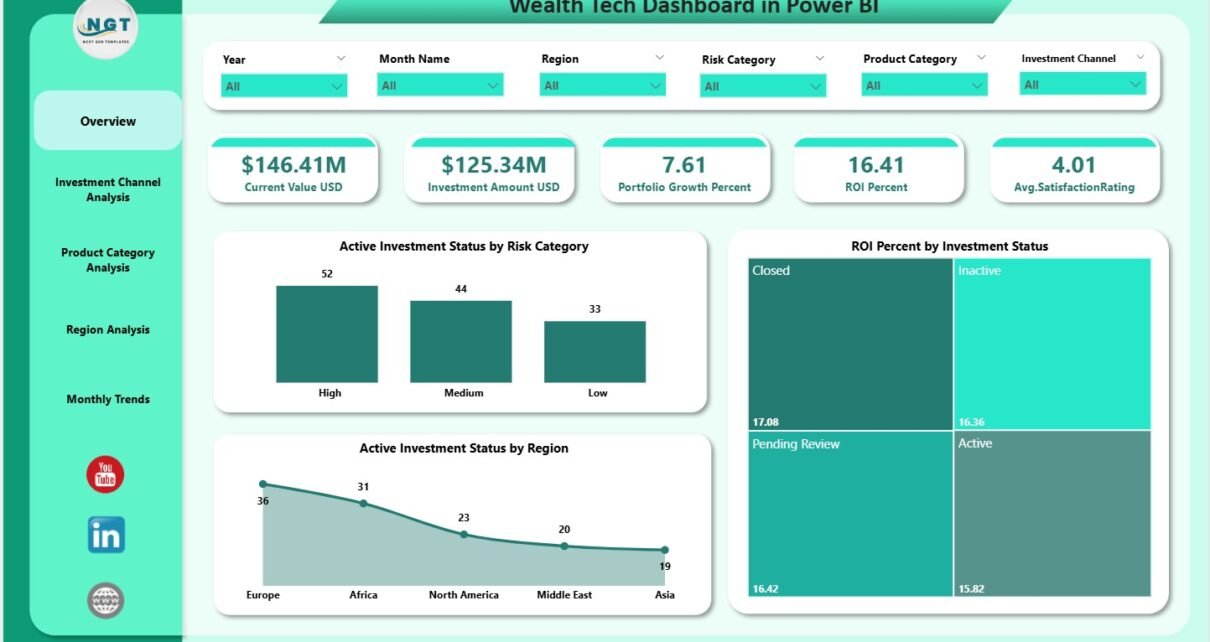
Wealth Tech Dashboard in Power BI

December 3, 2025December 3, 2025 PKComments Off on Wealth Tech Dashboard in Power BI
Wealth management works best when you track your investments with clarity and confidence. Investors need fast access to portfolio performance, ROI, risk exposure, growth trends, and satisfaction ratings. However, when
Read More
Dashboard Power BI

Sovereign Wealth Funds Dashboard in Power BI

November 29, 2025November 29, 2025 PKComments Off on Sovereign Wealth Funds Dashboard in Power BI
Global markets move fast, and investment managers need accurate insights at the right time. Sovereign wealth funds (SWFs) deal with billions of dollars, long-term strategies, and complex portfolios spread across
Read More

Posts pagination

Previous 1 2 3 Next
  • Learn Excel (Free Course)
    • 1. Shortcut Keys
    • 2. Fill & Flash Fill
    • 3. Find & Replace
    • 4. Sort & Filter
    • 5. Formulas & Functions
    • 6. Data Validation
    • 7. Conditional Formatting
    • 8. Basic Charts
    • 9. Advanced Charts
    • 10. Pivot Tables
    • 11. Excel Dashboards
    • 12. VBA Course
    • 13. Excel Formulas with AI
  • Templates
  • Tutorials
    • Charts and Visualization
    • VBA
    • Excel Tips and Tricks
    • Excel Dashboards
    • Power Pivot & DAX
  • Power BI
  • Template Store
    • Ready to Use Templates
  • Courses
  • Academy
    • Excel + AI Mastery: 100 Formulas
    • Excel Pivot Tables & Dashboards
  • About Us
  • Contact Us
Copyright © 2023 PK-AnExcelExpert.com - Privacy Policy