New: NextGenTemplates Academy - video courses on Excel formulas with AI and Pivot Tables & dashboards. Early-bird: 20% off with code EARLYBIRD20 - first 20 orders only. See the courses →
  • Learn Excel (Free Course)
    • 1. Shortcut Keys
    • 2. Fill & Flash Fill
    • 3. Find & Replace
    • 4. Sort & Filter
    • 5. Formulas & Functions
    • 6. Data Validation
    • 7. Conditional Formatting
    • 8. Basic Charts
    • 9. Advanced Charts
    • 10. Pivot Tables
    • 11. Excel Dashboards
    • 12. VBA Course
    • 13. Excel Formulas with AI
  • Templates
  • Tutorials
    • Charts and Visualization
    • VBA
    • Excel Tips and Tricks
    • Excel Dashboards
    • Power Pivot & DAX
  • Power BI
  • Template Store
    • Ready to Use Templates
  • Courses
  • Academy
    • Excel + AI Mastery: 100 Formulas
    • Excel Pivot Tables & Dashboards
  • About Us
  • Contact Us

PK: An Excel Expert

Transforming Data into Decisions

Tag: financial-KPI-dashboard

Dashboard Power BI

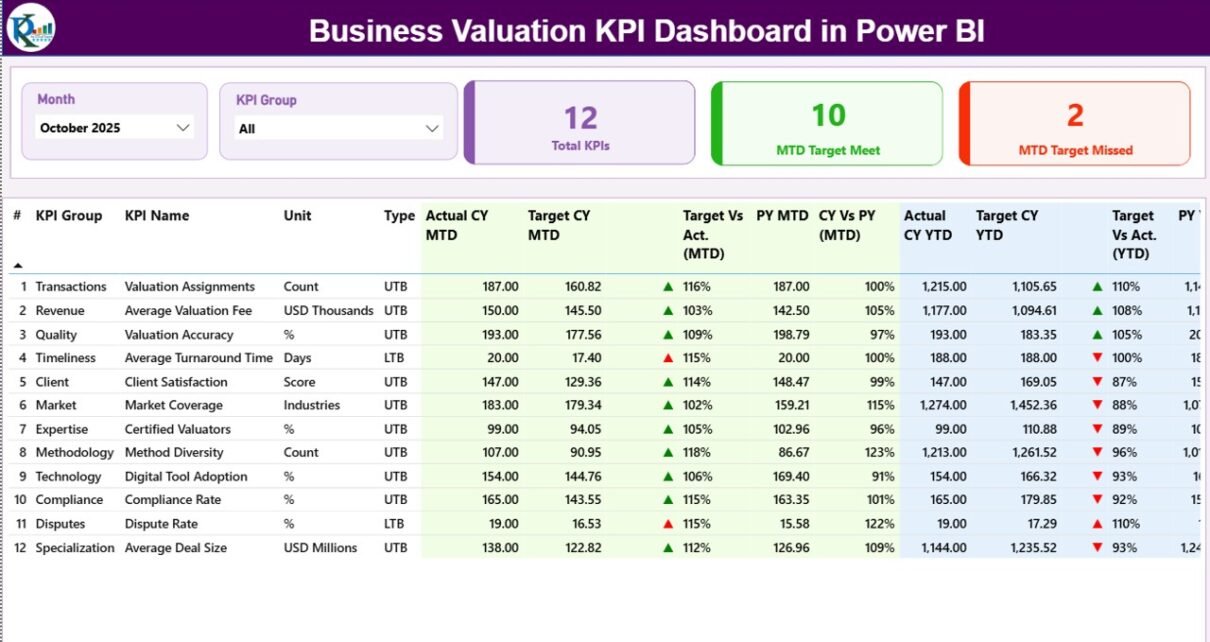
Business Valuation KPI Dashboard in Power BI

March 11, 2026March 11, 2026 PKComments Off on Business Valuation KPI Dashboard in Power BI
In today’s competitive business environment, organizations must monitor financial performance, valuation metrics, and strategic indicators regularly. Business valuation professionals, financial analysts, investors, and consulting firms depend on accurate performance tracking
Read More
Power Pivot

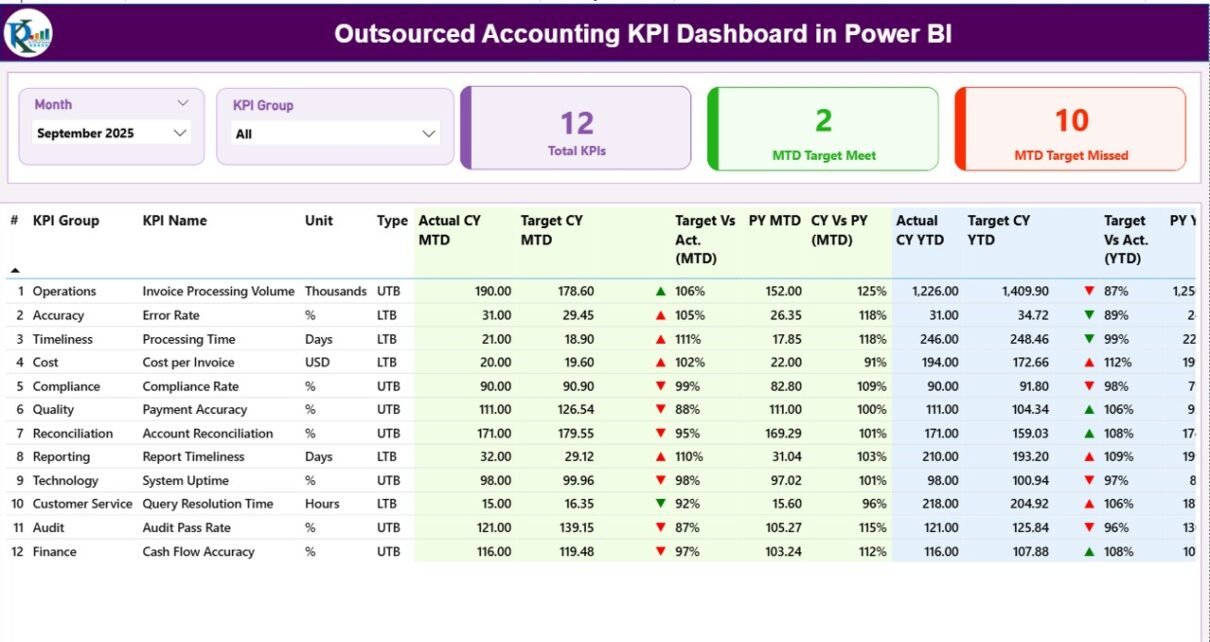
Outsourced Accounting KPI Dashboard in Power BI

March 10, 2026March 10, 2026 PKComments Off on Outsourced Accounting KPI Dashboard in Power BI
Managing outsourced accounting services requires accurate performance tracking, transparency, and data-driven decision making. However, many organizations still rely on scattered spreadsheets and manual reporting. As a result, managers struggle to
Read More
Dashboard Power BI

Treasury Management KPI Dashboard in Power BI

January 2, 2026January 2, 2026 PKComments Off on Treasury Management KPI Dashboard in Power BI
In today’s fast-moving financial environment, treasury teams must make decisions quickly and accurately. However, when cash positions, liquidity data, funding metrics, and risk indicators remain scattered across spreadsheets, decision-making becomes
Read More
Dashboard

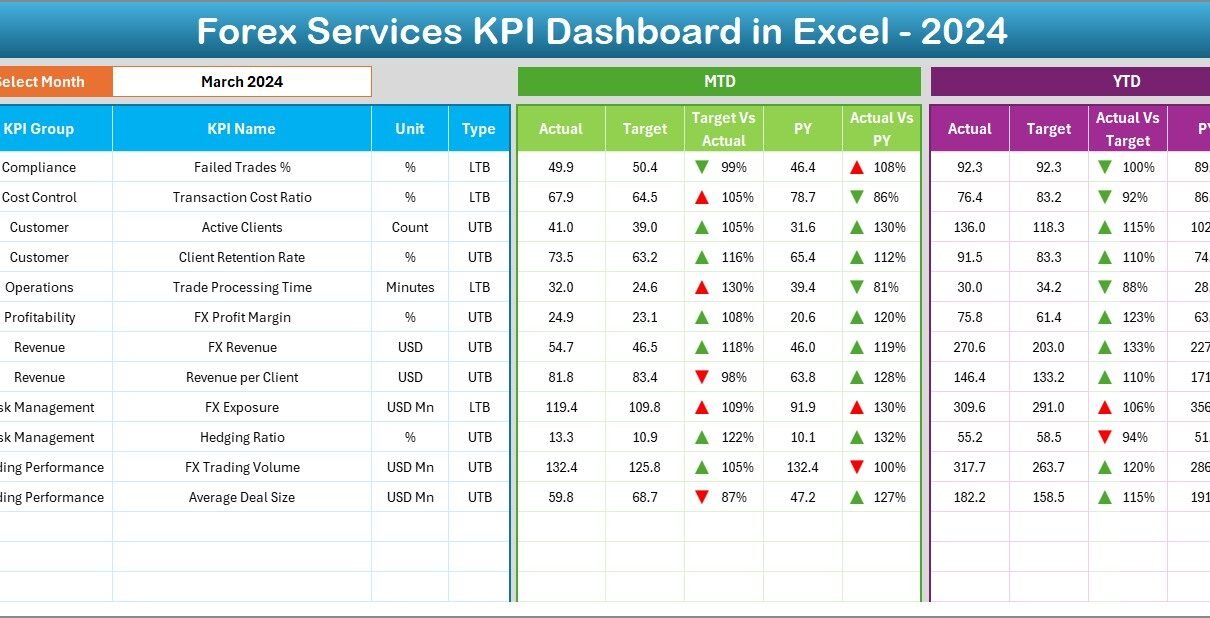
Forex Services KPI Dashboard in Excel

December 31, 2025December 31, 2025 PKComments Off on Forex Services KPI Dashboard in Excel
Managing forex services without clear performance tracking feels like navigating a fast-moving market without charts. Rates fluctuate every second, volumes change daily, and margins remain tight. Therefore, forex service providers
Read More
Dashboard

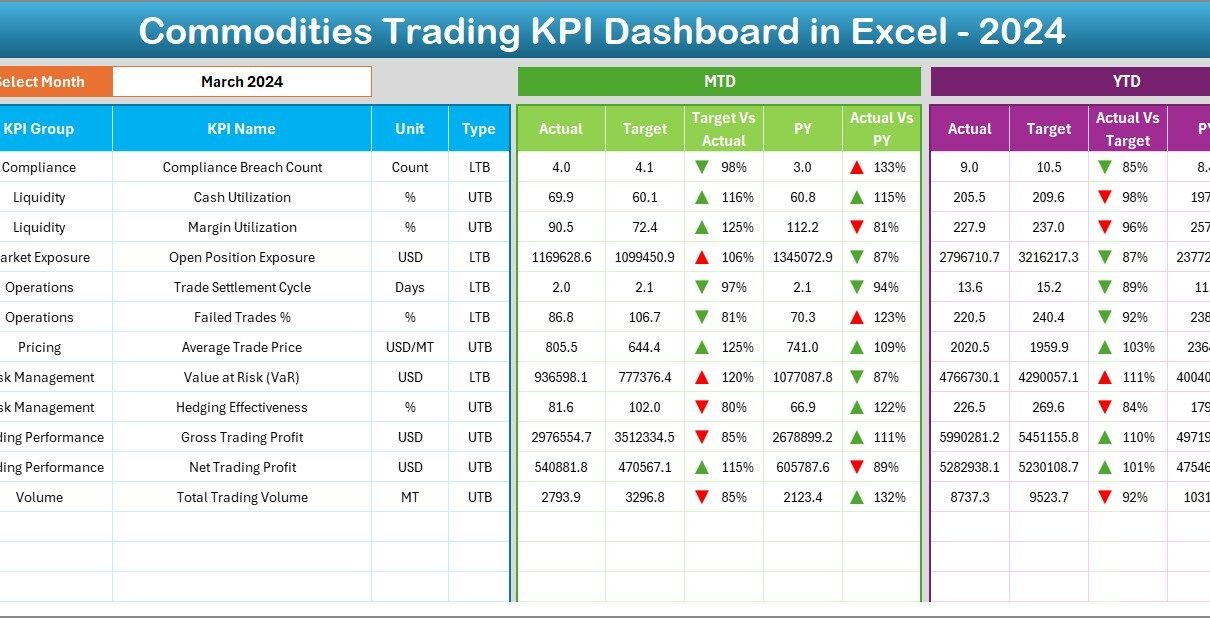
Commodities Trading KPI Dashboard in Excel

December 24, 2025December 24, 2025 PKComments Off on Commodities Trading KPI Dashboard in Excel
Managing performance in commodities trading never feels simple. You track prices, volumes, margins, risks, and profitability every single day. Moreover, markets move fast, and even a small delay in analysis
Read More
Dashboard Power BI

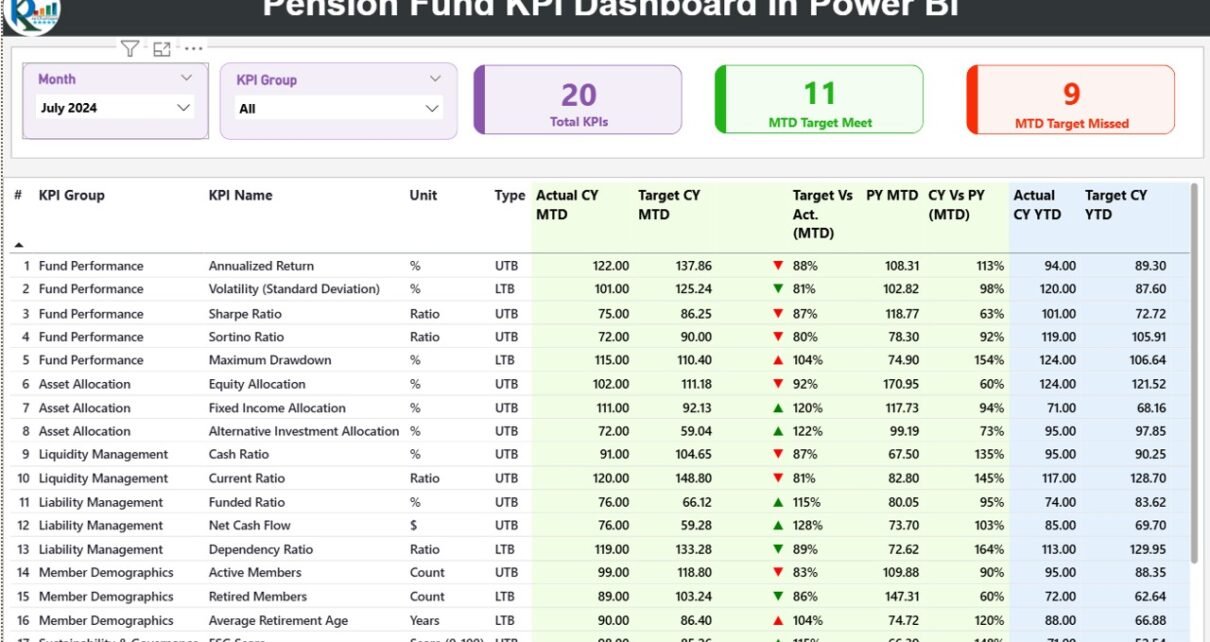
Pension Fund KPI Dashboard in Power BI

December 10, 2025December 10, 2025 PKComments Off on Pension Fund KPI Dashboard in Power BI
Managing pension funds demands accuracy, transparency, and timely decision-making. However, traditional reports, scattered Excel files, and delayed insights often make pension fund monitoring difficult. Therefore, pension fund managers increasingly rely
Read More
Dashboard

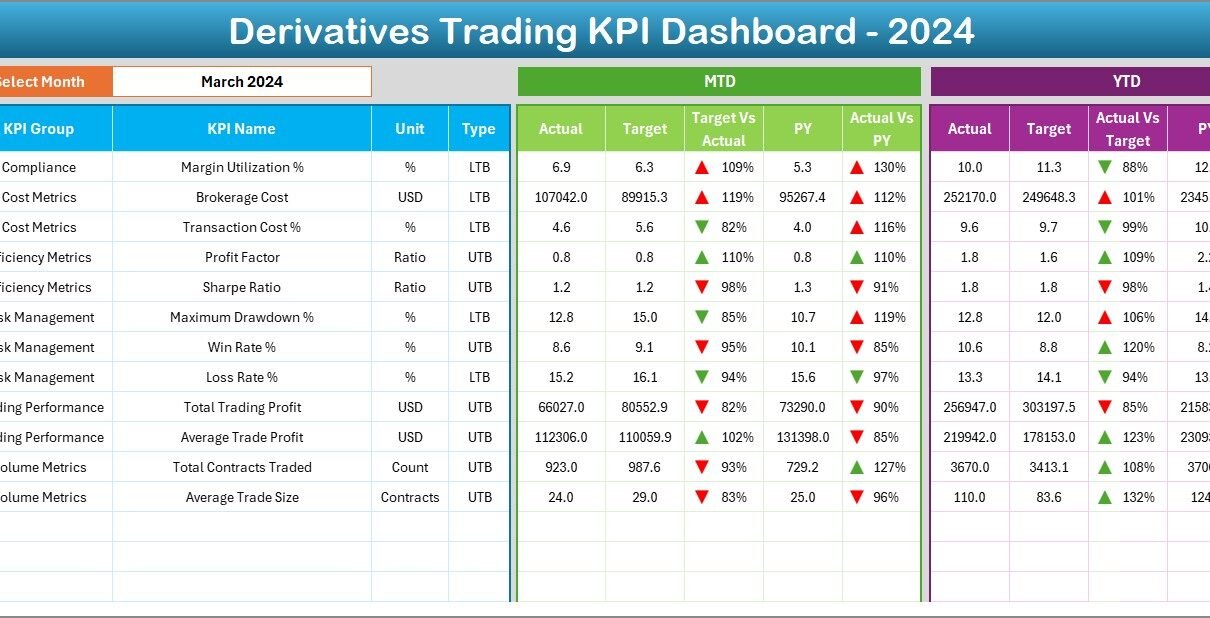
Derivatives Trading KPI Dashboard in Excel

December 9, 2025December 9, 2025 PKComments Off on Derivatives Trading KPI Dashboard in Excel
Derivatives trading involves high risk, fast decisions, and constant performance pressure. Traders, portfolio managers, and risk teams must track results daily, monthly, and yearly to stay profitable and compliant. However,
Read More
Power BI

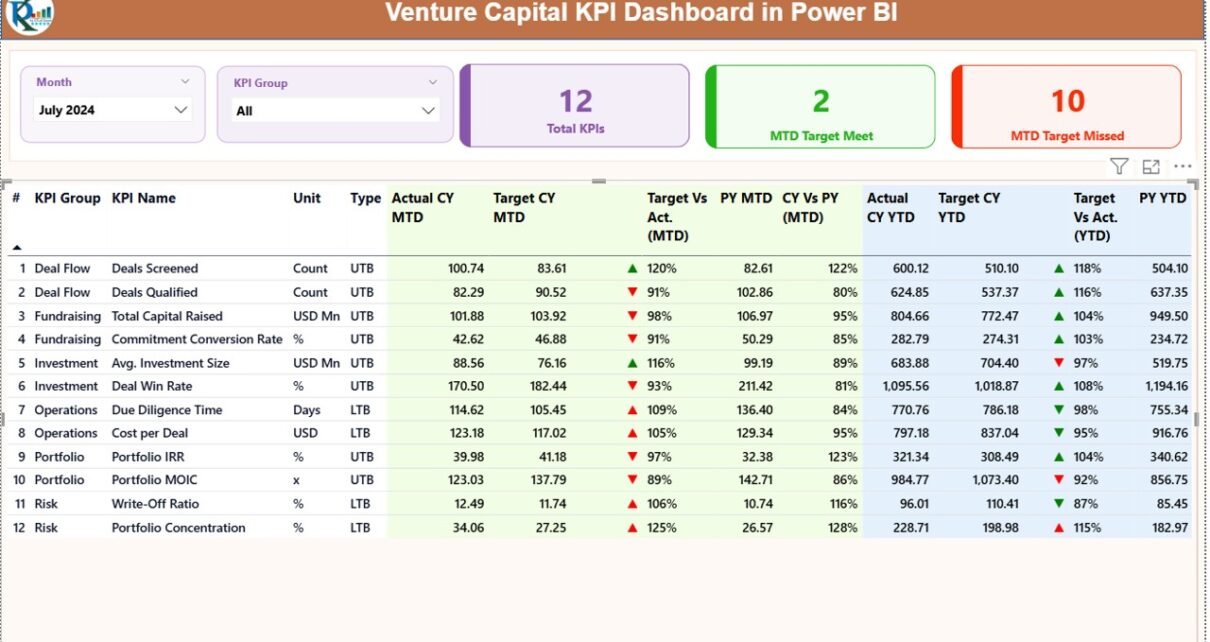
Venture Capital KPI Dashboard in Power BI

December 8, 2025December 8, 2025 PKComments Off on Venture Capital KPI Dashboard in Power BI
Venture capital firms operate in a fast-moving, high-risk environment. Therefore, partners, analysts, and fund managers must always track performance accurately. However, manual Excel reports, scattered data files, and delayed reviews
Read More
Power BI

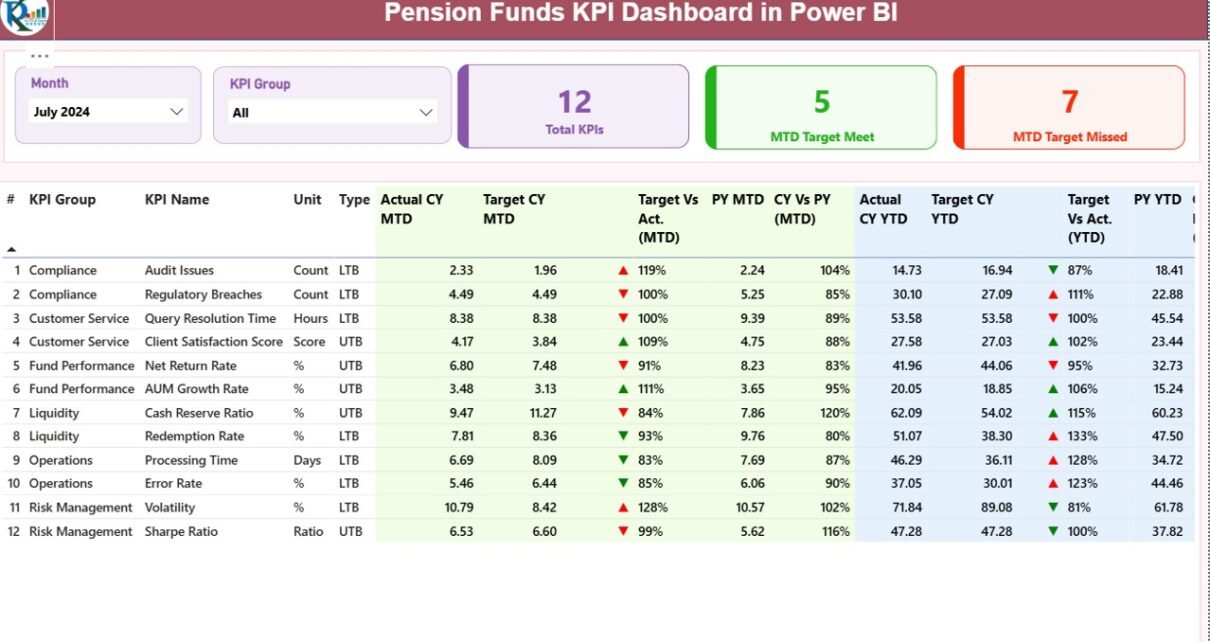
Pension Funds KPI Dashboard in Power BI

December 8, 2025December 8, 2025 PKComments Off on Pension Funds KPI Dashboard in Power BI
Managing pension funds involves responsibility, accuracy, and long-term vision. Every decision directly impacts retirees, employees, and financial stability. Therefore, pension fund managers must track performance carefully and act quickly when
Read More
Power BI

Stock Exchanges KPI Dashboard in Power BI

December 7, 2025December 7, 2025 PKComments Off on Stock Exchanges KPI Dashboard in Power BI
In today’s fast-moving financial markets, stock exchanges generate massive volumes of data every single day. However, numbers alone do not create clarity. To stay competitive, exchanges, regulators, analysts, and leadership
Read More

Posts pagination

1 2 Next
  • Learn Excel (Free Course)
    • 1. Shortcut Keys
    • 2. Fill & Flash Fill
    • 3. Find & Replace
    • 4. Sort & Filter
    • 5. Formulas & Functions
    • 6. Data Validation
    • 7. Conditional Formatting
    • 8. Basic Charts
    • 9. Advanced Charts
    • 10. Pivot Tables
    • 11. Excel Dashboards
    • 12. VBA Course
    • 13. Excel Formulas with AI
  • Templates
  • Tutorials
    • Charts and Visualization
    • VBA
    • Excel Tips and Tricks
    • Excel Dashboards
    • Power Pivot & DAX
  • Power BI
  • Template Store
    • Ready to Use Templates
  • Courses
  • Academy
    • Excel + AI Mastery: 100 Formulas
    • Excel Pivot Tables & Dashboards
  • About Us
  • Contact Us
Copyright © 2023 PK-AnExcelExpert.com - Privacy Policy