New: NextGenTemplates Academy - video courses on Excel formulas with AI and Pivot Tables & dashboards. Early-bird: 20% off with code EARLYBIRD20 - first 20 orders only. See the courses →
  • Learn Excel (Free Course)
    • 1. Shortcut Keys
    • 2. Fill & Flash Fill
    • 3. Find & Replace
    • 4. Sort & Filter
    • 5. Formulas & Functions
    • 6. Data Validation
    • 7. Conditional Formatting
    • 8. Basic Charts
    • 9. Advanced Charts
    • 10. Pivot Tables
    • 11. Excel Dashboards
    • 12. VBA Course
    • 13. Excel Formulas with AI
  • Templates
  • Tutorials
    • Charts and Visualization
    • VBA
    • Excel Tips and Tricks
    • Excel Dashboards
    • Power Pivot & DAX
  • Power BI
  • Template Store
    • Ready to Use Templates
  • Courses
  • Academy
    • Excel + AI Mastery: 100 Formulas
    • Excel Pivot Tables & Dashboards
  • About Us
  • Contact Us

PK: An Excel Expert

Transforming Data into Decisions

Tag: Financial metrics

Dashboard

Business Valuation Dashboard in Excel

March 17, 2026March 17, 2026 PKComments Off on Business Valuation Dashboard in Excel
In today’s competitive business environment, understanding the true value of a company plays a critical role in decision-making. Whether you plan mergers, acquisitions, investments, or strategic growth, you must rely
Read More
Dashboard

Finance and Accounting Quality Assurance KPI Dashboard in Excel

April 19, 2025April 19, 2025 PKComments Off on Finance and Accounting Quality Assurance KPI Dashboard in Excel
In today's fast-paced business world, ensuring financial accuracy and accountability is more important than ever. Companies must maintain the highest quality in their finance and accounting operations to gain trust,
Read More
Dashboard

Banking Operations KPI Dashboard in Excel

March 10, 2025March 10, 2025 PKComments Off on Banking Operations KPI Dashboard in Excel
The financial world thrives on data, and for banking operations, the key to success is not just analyzing raw figures but tracking them with precision. One of the best ways
Read More
Dashboard

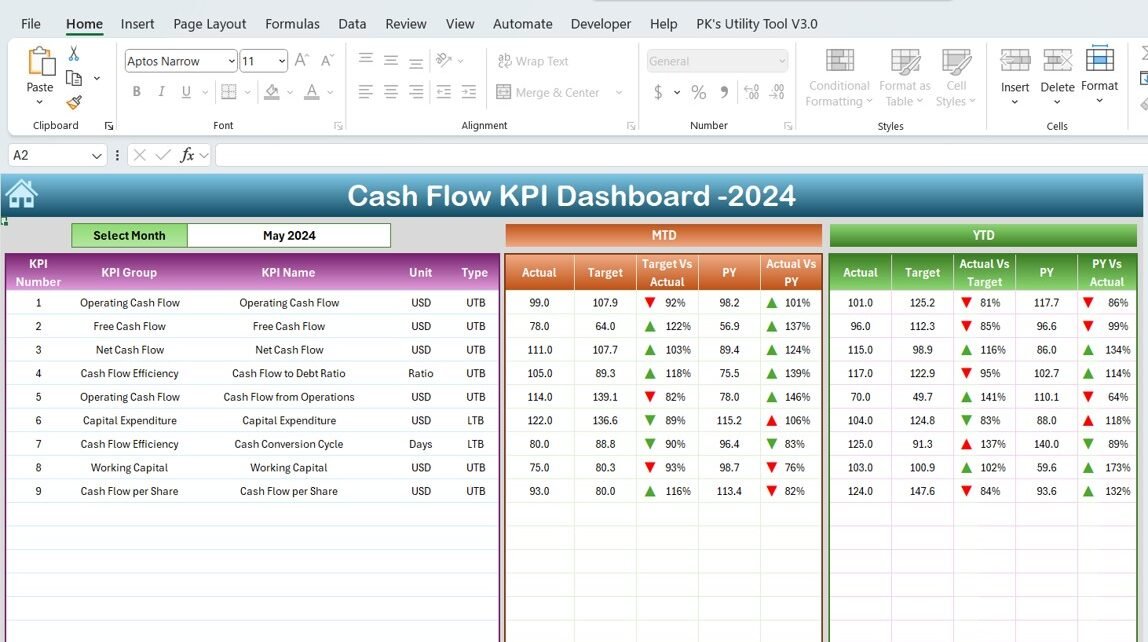
Cash Flow KPI Dashboard in Excel

March 2, 2025March 2, 2025 PKComments Off on Cash Flow KPI Dashboard in Excel
A Cash Flow KPI Dashboard is a powerful tool that helps businesses monitor, manage, and forecast their cash flow more effectively. With real-time data on key performance indicators (KPIs), it
Read More
Power BI

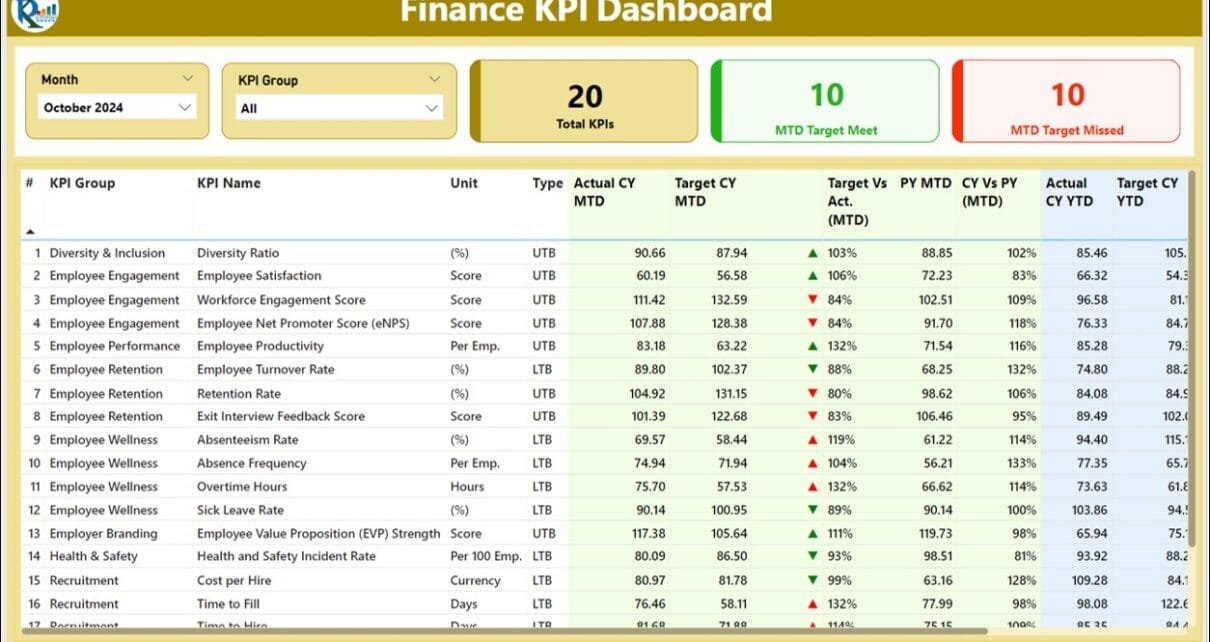
Finance KPI Dashboard in Power BI

December 3, 2024March 2, 2025 PKComments Off on Finance KPI Dashboard in Power BI
In today's data-driven business landscape, tracking financial performance effectively is crucial. A Finance KPI Dashboard in Power BI helps businesses monitor key performance indicators (KPIs) in real time, providing actionable
Read More
  • Learn Excel (Free Course)
    • 1. Shortcut Keys
    • 2. Fill & Flash Fill
    • 3. Find & Replace
    • 4. Sort & Filter
    • 5. Formulas & Functions
    • 6. Data Validation
    • 7. Conditional Formatting
    • 8. Basic Charts
    • 9. Advanced Charts
    • 10. Pivot Tables
    • 11. Excel Dashboards
    • 12. VBA Course
    • 13. Excel Formulas with AI
  • Templates
  • Tutorials
    • Charts and Visualization
    • VBA
    • Excel Tips and Tricks
    • Excel Dashboards
    • Power Pivot & DAX
  • Power BI
  • Template Store
    • Ready to Use Templates
  • Courses
  • Academy
    • Excel + AI Mastery: 100 Formulas
    • Excel Pivot Tables & Dashboards
  • About Us
  • Contact Us
Copyright © 2023 PK-AnExcelExpert.com - Privacy Policy