New: NextGenTemplates Academy - video courses on Excel formulas with AI and Pivot Tables & dashboards. Early-bird: 20% off with code EARLYBIRD20 - first 20 orders only. See the courses →
  • Learn Excel (Free Course)
    • 1. Shortcut Keys
    • 2. Fill & Flash Fill
    • 3. Find & Replace
    • 4. Sort & Filter
    • 5. Formulas & Functions
    • 6. Data Validation
    • 7. Conditional Formatting
    • 8. Basic Charts
    • 9. Advanced Charts
    • 10. Pivot Tables
    • 11. Excel Dashboards
    • 12. VBA Course
    • 13. Excel Formulas with AI
  • Templates
  • Tutorials
    • Charts and Visualization
    • VBA
    • Excel Tips and Tricks
    • Excel Dashboards
    • Power Pivot & DAX
  • Power BI
  • Template Store
    • Ready to Use Templates
  • Courses
  • Academy
    • Excel + AI Mastery: 100 Formulas
    • Excel Pivot Tables & Dashboards
  • About Us
  • Contact Us

PK: An Excel Expert

Transforming Data into Decisions

Tag: financial reporting Excel

Power BI

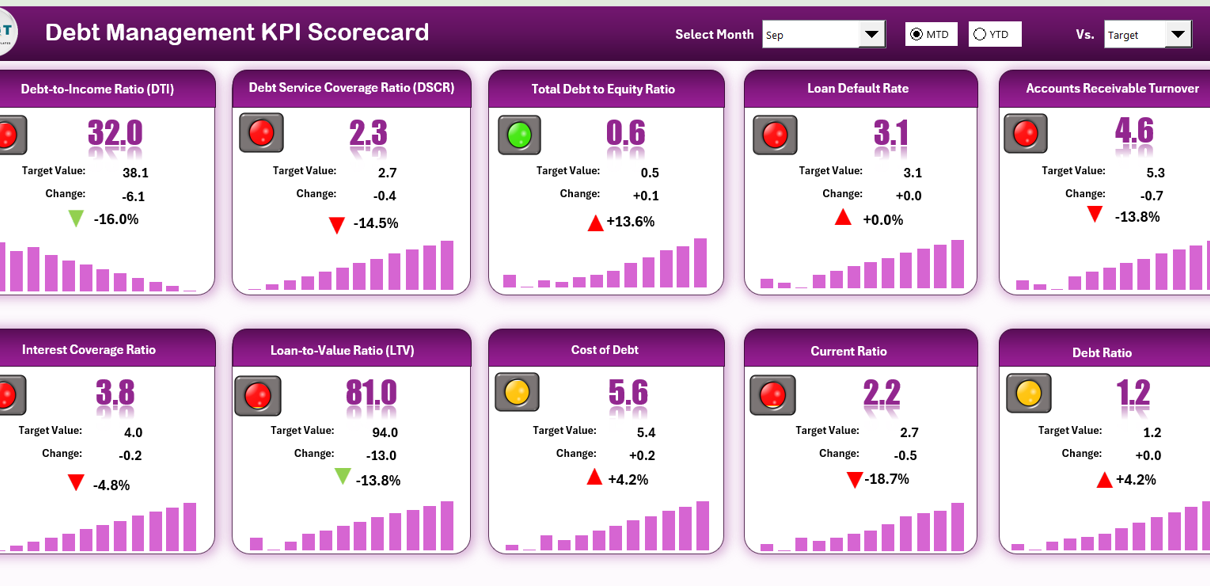
Debt Management KPI Scorecard in Excel

March 8, 2026March 8, 2026 PKComments Off on Debt Management KPI Scorecard in Excel
Managing debt effectively has become extremely important for organizations, financial institutions, and even individuals. Businesses often rely on loans, credit facilities, and other financing options to support operations and growth.
Read More
Dashboard

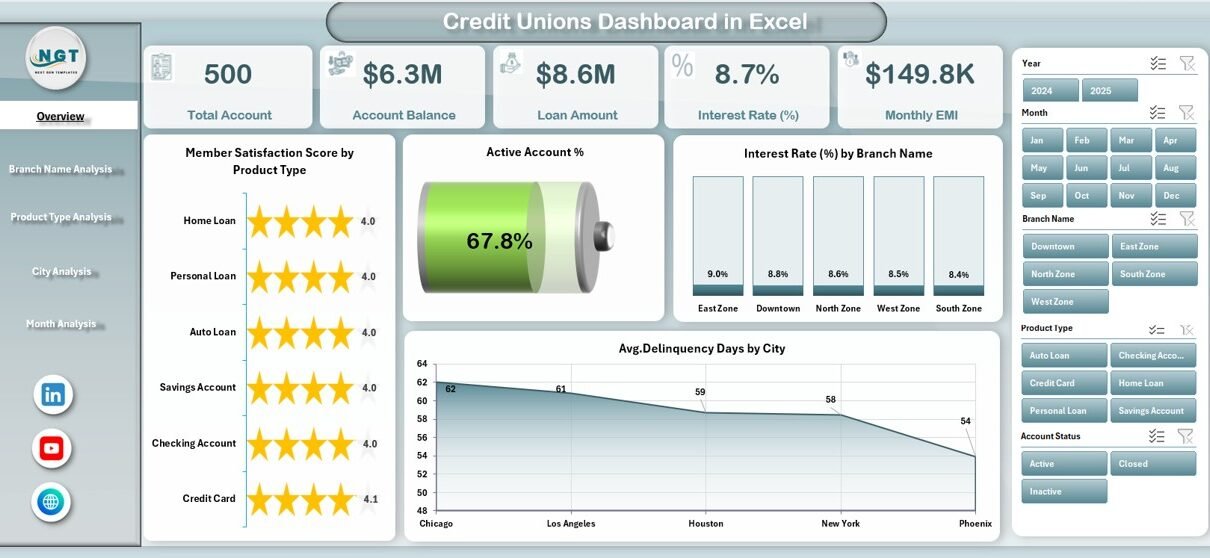
Credit Unions Dashboard in Excel

January 23, 2026January 23, 2026 PKComments Off on Credit Unions Dashboard in Excel
Managing a credit union today requires more than traditional reports and static spreadsheets. Credit unions must track member satisfaction, monitor loan performance, manage delinquency risk, analyze branch efficiency, and compare
Read More
Dashboard

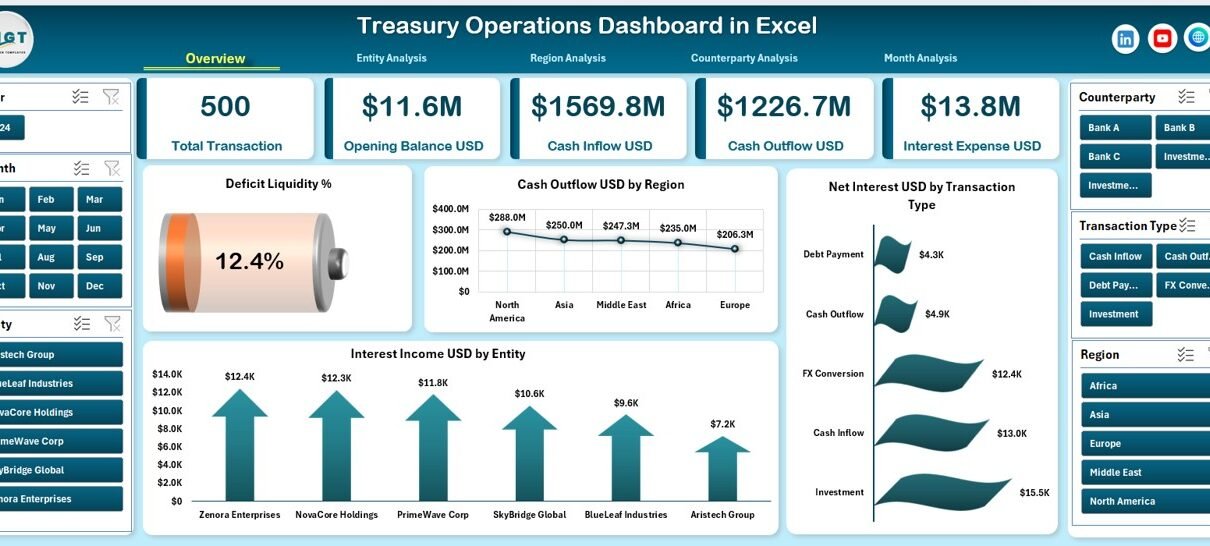
Treasury Operations Dashboard in Excel

December 18, 2025December 18, 2025 PKComments Off on Treasury Operations Dashboard in Excel
Managing treasury operations has become more complex than ever. Cash inflows and outflows change daily. Interest income and expenses fluctuate across entities, regions, and counterparties. Moreover, liquidity risk continues to
Read More
Dashboard

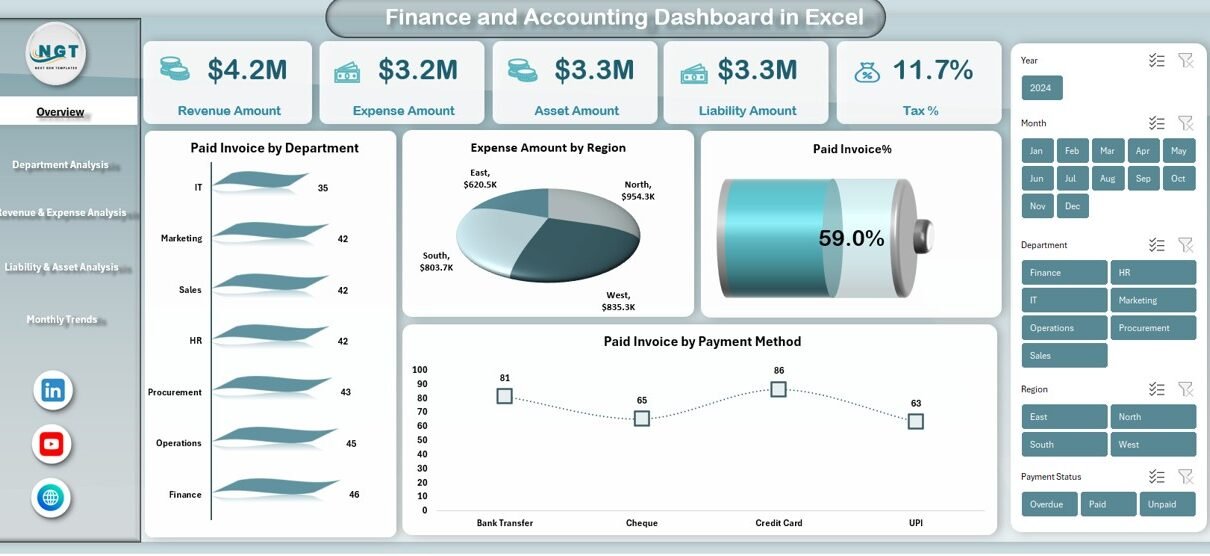
Finance and Accounting Dashboard in Excel

December 17, 2025December 17, 2025 PKComments Off on Finance and Accounting Dashboard in Excel
Managing finance and accounting data often feels overwhelming. Revenue, expenses, assets, liabilities, taxes, invoices, and trends keep changing every month. However, when data stays scattered across multiple files, decision-making becomes
Read More
Dashboard

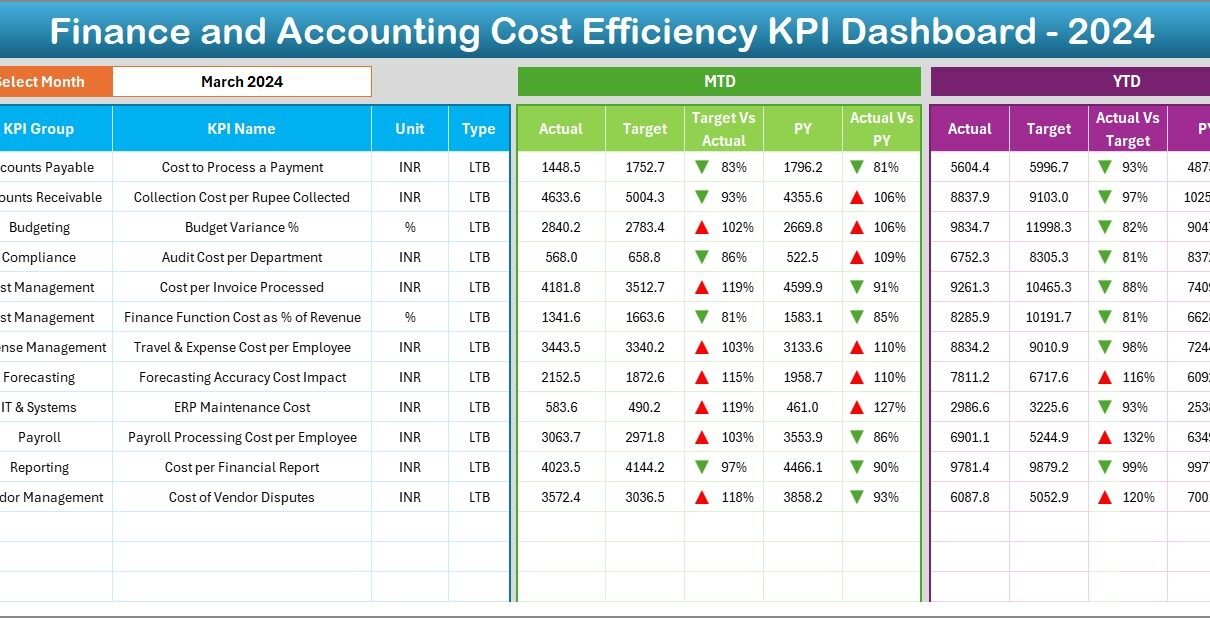
Finance and Accounting Cost Efficiency KPI Dashboard in Excel

April 19, 2025April 19, 2025 PKComments Off on Finance and Accounting Cost Efficiency KPI Dashboard in Excel
Managing cost efficiency in finance and accounting is essential for business success. However, tracking all the moving parts can be overwhelming without the right tools. That’s where the Finance and
Read More
  • Learn Excel (Free Course)
    • 1. Shortcut Keys
    • 2. Fill & Flash Fill
    • 3. Find & Replace
    • 4. Sort & Filter
    • 5. Formulas & Functions
    • 6. Data Validation
    • 7. Conditional Formatting
    • 8. Basic Charts
    • 9. Advanced Charts
    • 10. Pivot Tables
    • 11. Excel Dashboards
    • 12. VBA Course
    • 13. Excel Formulas with AI
  • Templates
  • Tutorials
    • Charts and Visualization
    • VBA
    • Excel Tips and Tricks
    • Excel Dashboards
    • Power Pivot & DAX
  • Power BI
  • Template Store
    • Ready to Use Templates
  • Courses
  • Academy
    • Excel + AI Mastery: 100 Formulas
    • Excel Pivot Tables & Dashboards
  • About Us
  • Contact Us
Copyright © 2023 PK-AnExcelExpert.com - Privacy Policy