New: NextGenTemplates Academy - video courses on Excel formulas with AI and Pivot Tables & dashboards. Early-bird: 20% off with code EARLYBIRD20 - first 20 orders only.See the courses →
PKComments Off on Fleet Fuel Log Data Entry System in Excel
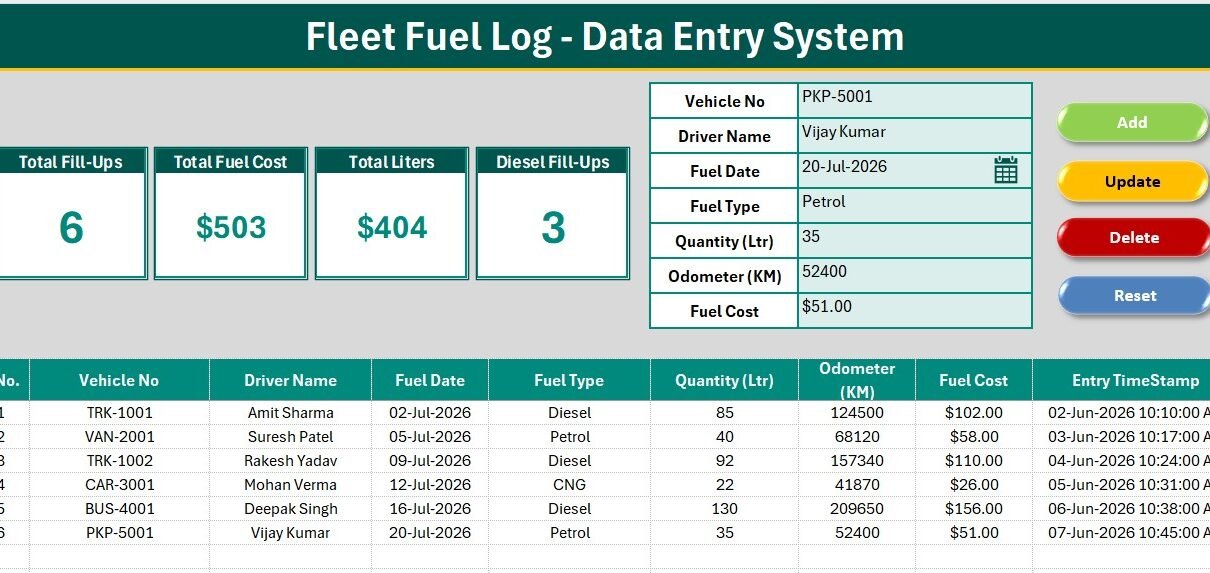
The Fleet Fuel Log Data Entry System in Excel captures 7 fields for every fill-up — Vehicle No, Driver Name, Fuel Date, Fuel Type, Quantity in litres, Odometer reading and
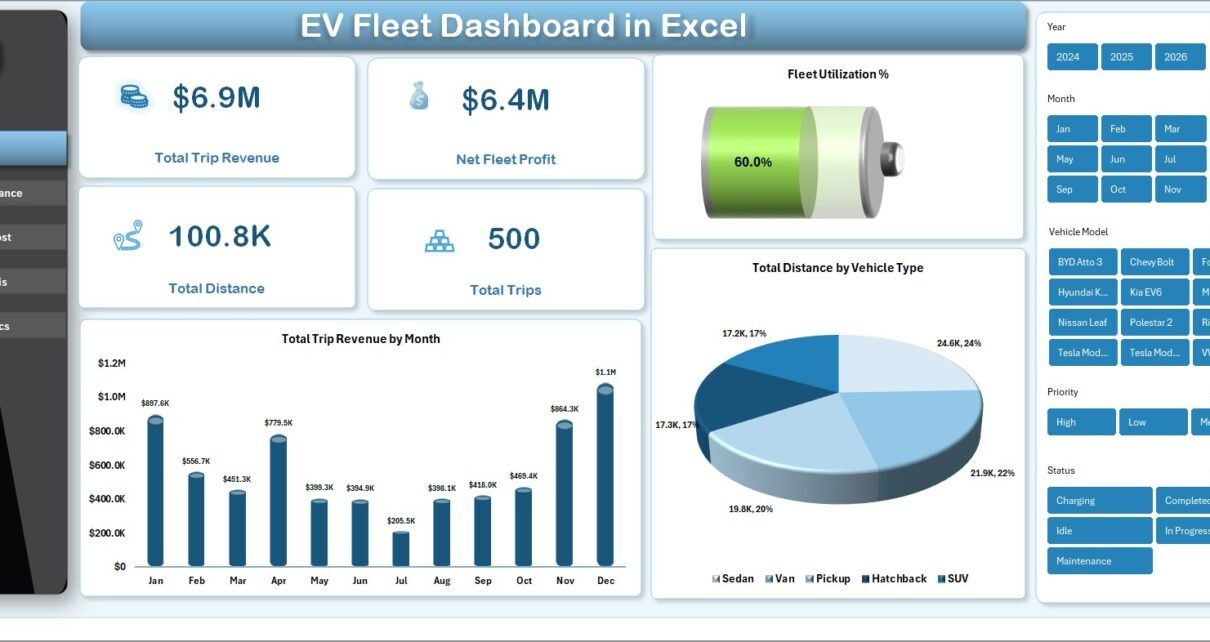
Electric fleet operators spend the largest share of their operating cost on charging — and most teams still rely on a spreadsheet for board reporting. The EV Fleet Dashboard in
The EV Fleet Dashboard in Excel is a pivot-driven workbook that consolidates 5 fleet KPIs across 5 interactive pages, with 14 pre-built charts and slicers covering trip revenue, energy consumption,
PKComments Off on Fleet Management Dashboard in Power BI
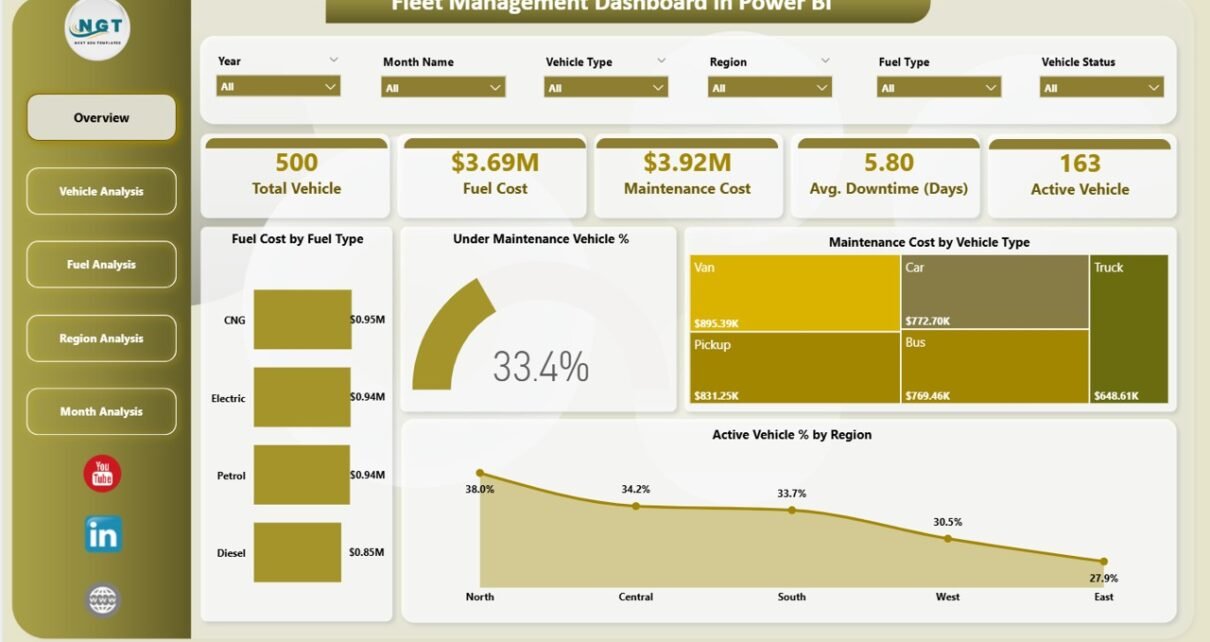
Managing a fleet without structured analytics creates confusion, rising costs, and operational delays. However, many fleet managers still rely on manual spreadsheets and disconnected reports. As a result, they struggle
PKComments Off on Car Rental Services Dashboard in Power BI
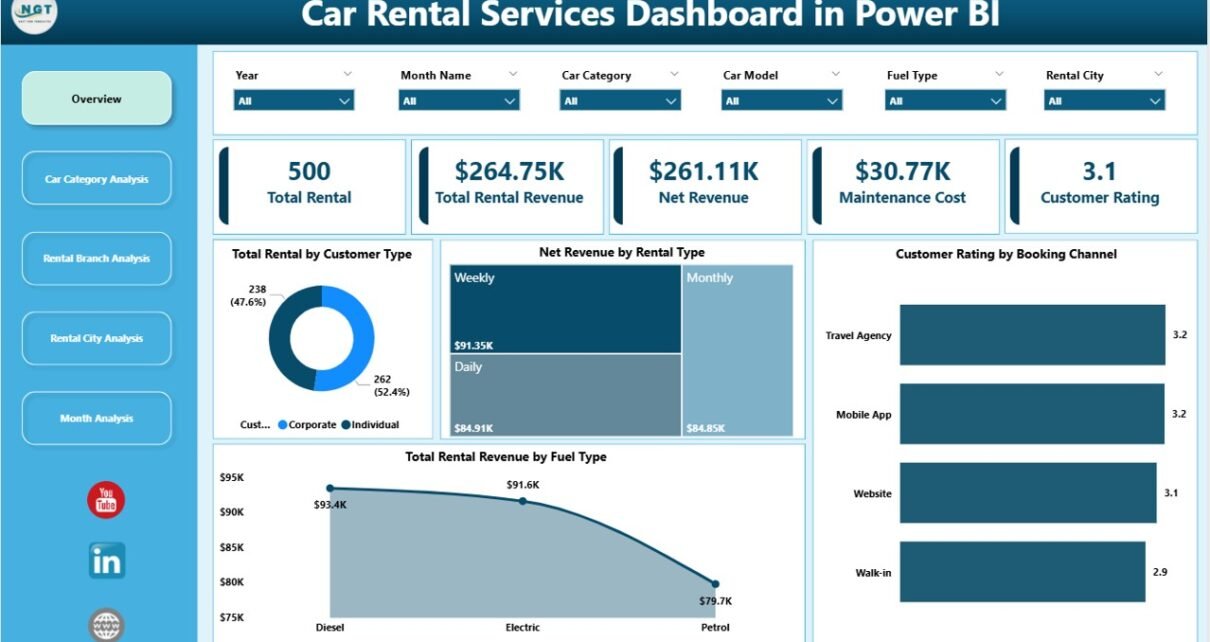
Managing a car rental business involves more than just renting vehicles. Every day, teams must track rentals, revenue, maintenance costs, customer behavior, and city-wise demand. However, when data remains scattered
PKComments Off on Fleet Management Dashboard in Excel
Managing a fleet has become more complex than ever before. Today, organizations must track fuel consumption, maintenance costs, vehicle availability, downtime, and regional performance at the same time. Therefore, relying
PKComments Off on Fleet-as-a-Service Dashboard in Excel
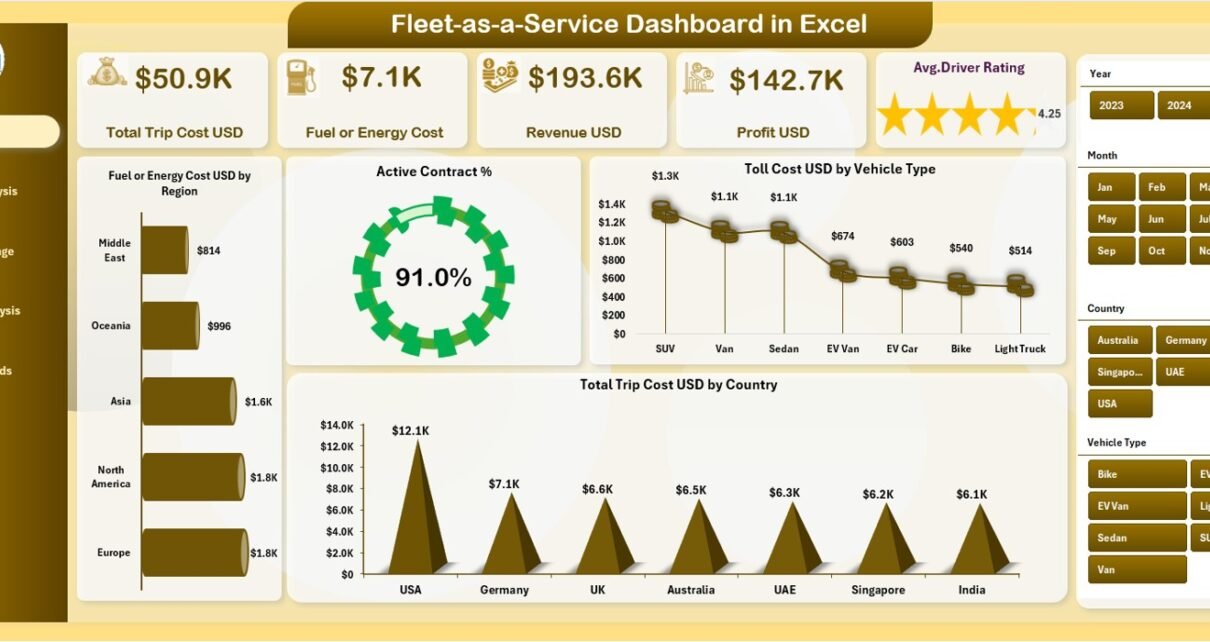
Fleet-as-a-Service (FaaS) has transformed how organizations manage transportation, mobility, and logistics. Instead of owning and maintaining large fleets, companies now focus on service-oriented fleet usage, performance, and profitability. However, without