New: NextGenTemplates Academy - video courses on Excel formulas with AI and Pivot Tables & dashboards. Early-bird: 20% off with code EARLYBIRD20 - first 20 orders only. See the courses →
  • Learn Excel (Free Course)
    • 1. Shortcut Keys
    • 2. Fill & Flash Fill
    • 3. Find & Replace
    • 4. Sort & Filter
    • 5. Formulas & Functions
    • 6. Data Validation
    • 7. Conditional Formatting
    • 8. Basic Charts
    • 9. Advanced Charts
    • 10. Pivot Tables
    • 11. Excel Dashboards
    • 12. VBA Course
    • 13. Excel Formulas with AI
  • Templates
  • Tutorials
    • Charts and Visualization
    • VBA
    • Excel Tips and Tricks
    • Excel Dashboards
    • Power Pivot & DAX
  • Power BI
  • Template Store
    • Ready to Use Templates
  • Courses
  • Academy
    • Excel + AI Mastery: 100 Formulas
    • Excel Pivot Tables & Dashboards
  • About Us
  • Contact Us

PK: An Excel Expert

Transforming Data into Decisions

Tag: healthcare analytics

Dashboard

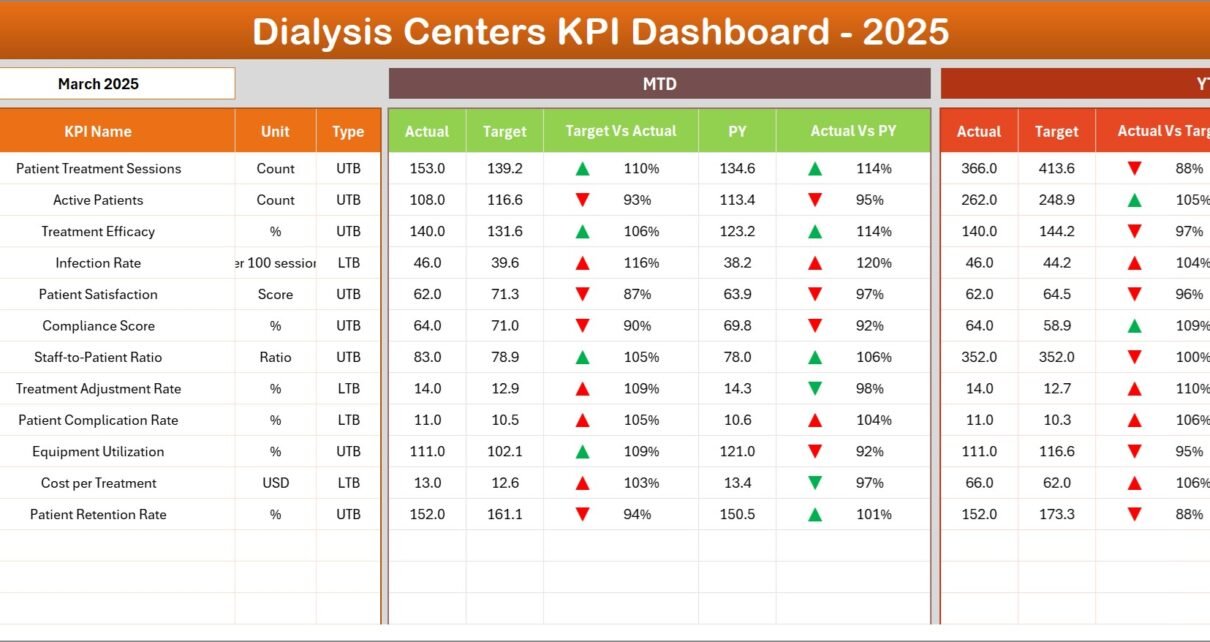
Dialysis Centers KPI Dashboard in Excel

March 16, 2026March 16, 2026 PKComments Off on Dialysis Centers KPI Dashboard in Excel
Dialysis Centers KPI Dashboard — Introduction Dialysis Centers KPI Dashboard is a ready-to-use Excel template designed to help clinic managers and analysts monitor clinical and operational KPIs. This post explains
Read More
Dashboard Power BI

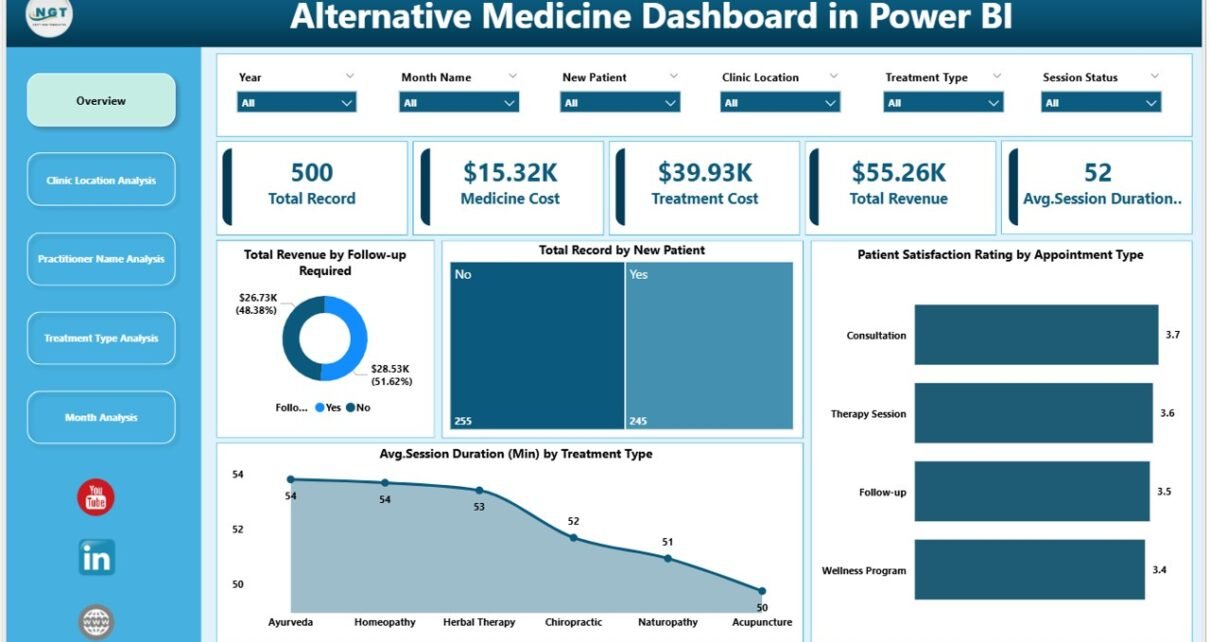
Alternative Medicine Dashboard in Power BI

February 23, 2026February 23, 2026 PKComments Off on Alternative Medicine Dashboard in Power BI
Alternative medicine has become a major part of modern healthcare. People now choose therapies such as acupuncture, chiropractic care, naturopathy, Ayurveda, homeopathy, reiki, and massage therapy not only for wellness,
Read More
Dashboard Power BI

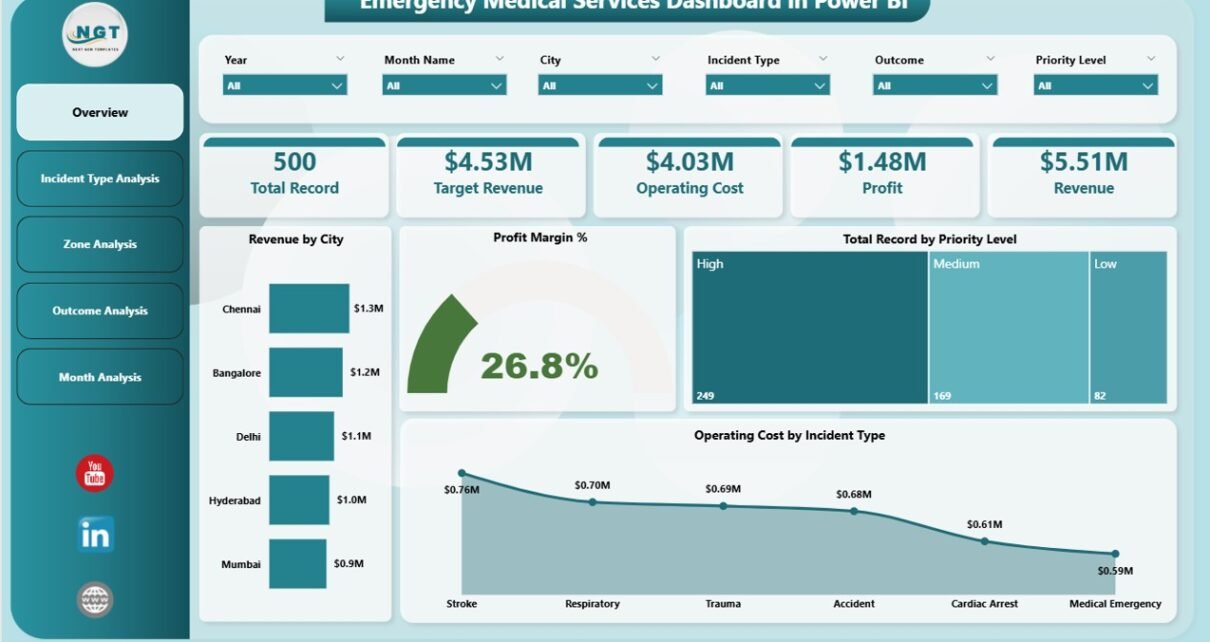
Emergency Medical Services Dashboard in Power BI

February 21, 2026February 21, 2026 PKComments Off on Emergency Medical Services Dashboard in Power BI
Emergency Medical Services (EMS) play a critical role in saving lives. Every second matters during emergencies, and therefore organizations must make fast, accurate, and data-driven decisions. However, many EMS departments
Read More
Dashboard

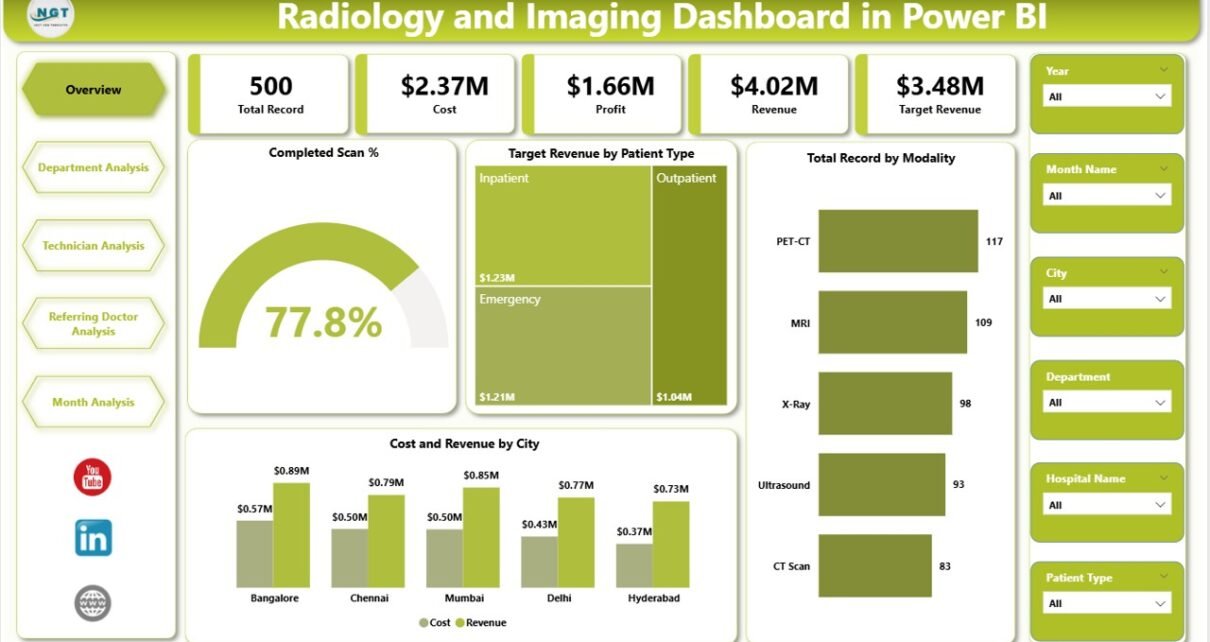
Radiology and Imaging Dashboard in Power BI

February 21, 2026February 21, 2026 PKComments Off on Radiology and Imaging Dashboard in Power BI
Healthcare organizations generate massive amounts of diagnostic data every day. Radiology and imaging centers handle thousands of scans, patient records, technician activities, and financial transactions monthly. However, many hospitals and
Read More
Dashboard Power BI

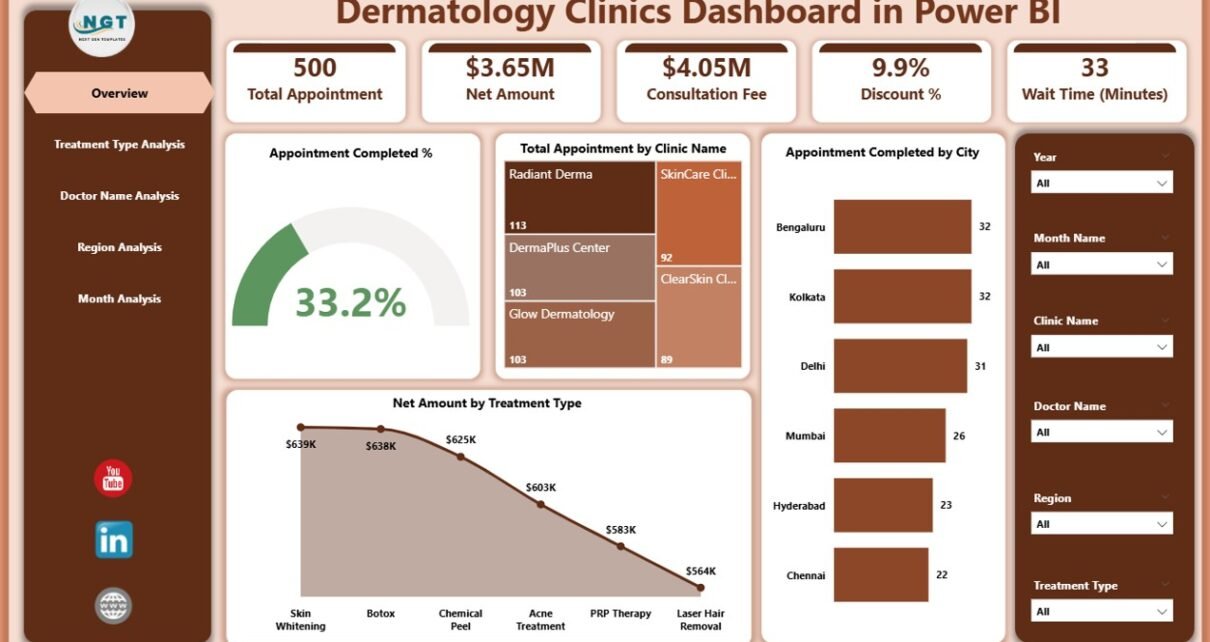
Dermatology Clinics Dashboard in Power BI

February 20, 2026February 20, 2026 PKComments Off on Dermatology Clinics Dashboard in Power BI
In today’s fast-moving healthcare environment, dermatology clinics must rely on data to stay competitive. However, many clinics still depend on scattered spreadsheets and manual reports. As a result, decision-makers struggle
Read More
Dashboard

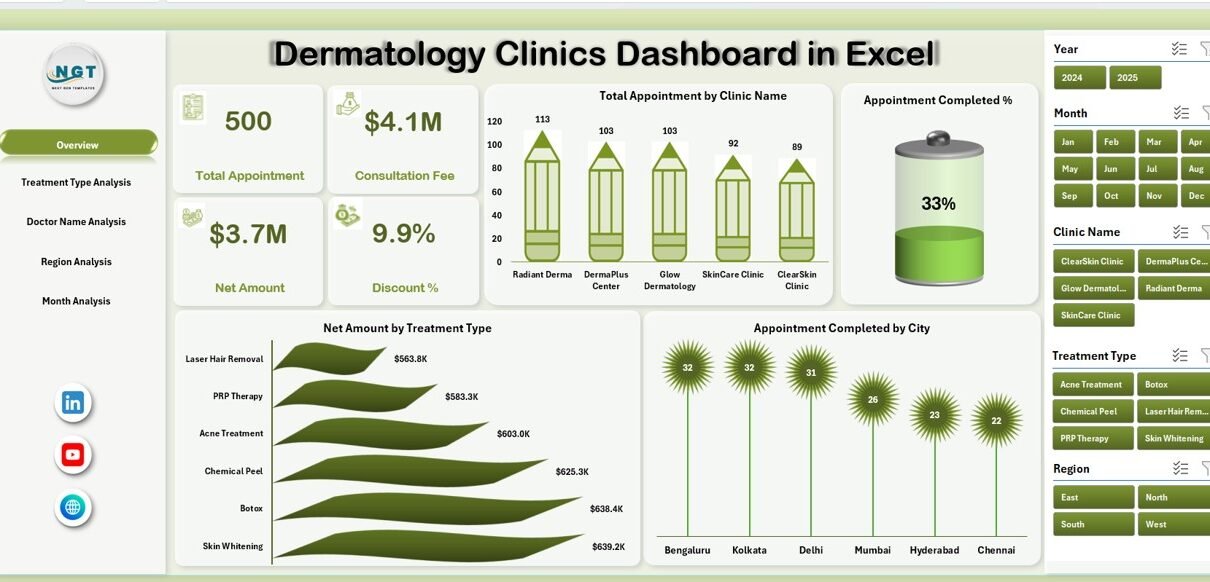
Dermatology Clinics Dashboard in Excel

February 20, 2026February 20, 2026 PKComments Off on Dermatology Clinics Dashboard in Excel
Healthcare providers today handle massive volumes of patient and treatment data. However, many dermatology clinics still rely on scattered spreadsheets and manual reports. As a result, decision-makers often struggle to
Read More
Dashboard Power BI

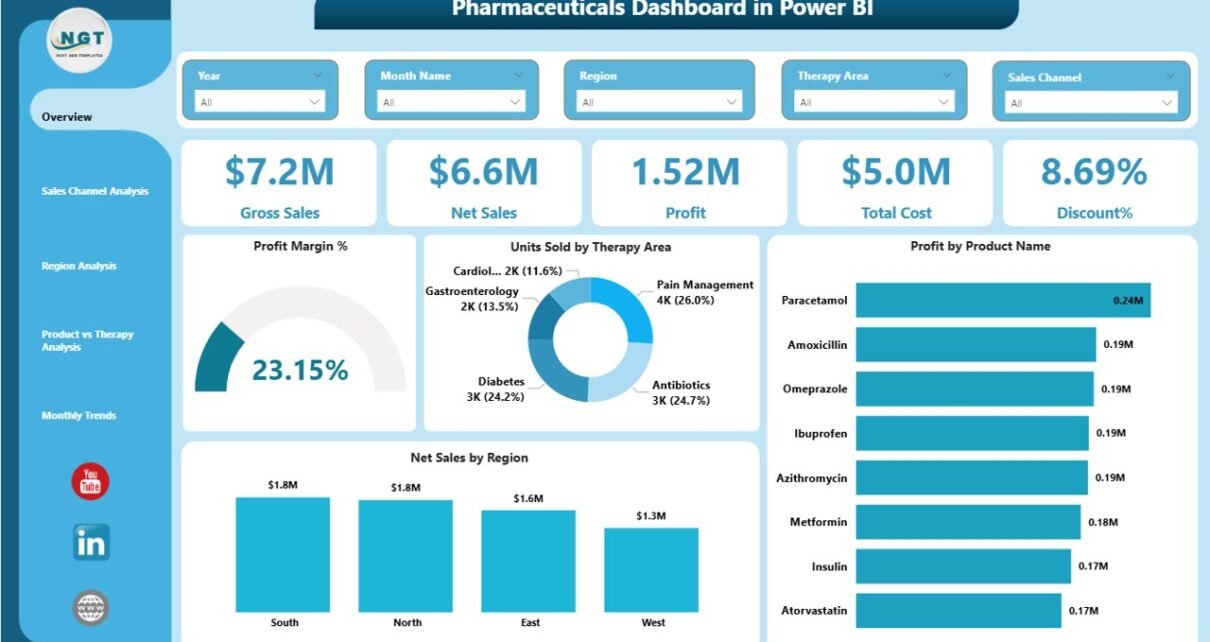
Pharmaceuticals Dashboard in Power BI

February 15, 2026February 15, 2026 PKComments Off on Pharmaceuticals Dashboard in Power BI
The pharmaceutical industry moves fast. Regulations change often. Competition grows every year. Pricing pressure increases across markets. Moreover, companies must balance innovation, compliance, profitability, and safety at the same time.However,
Read More
Dashboard Power BI

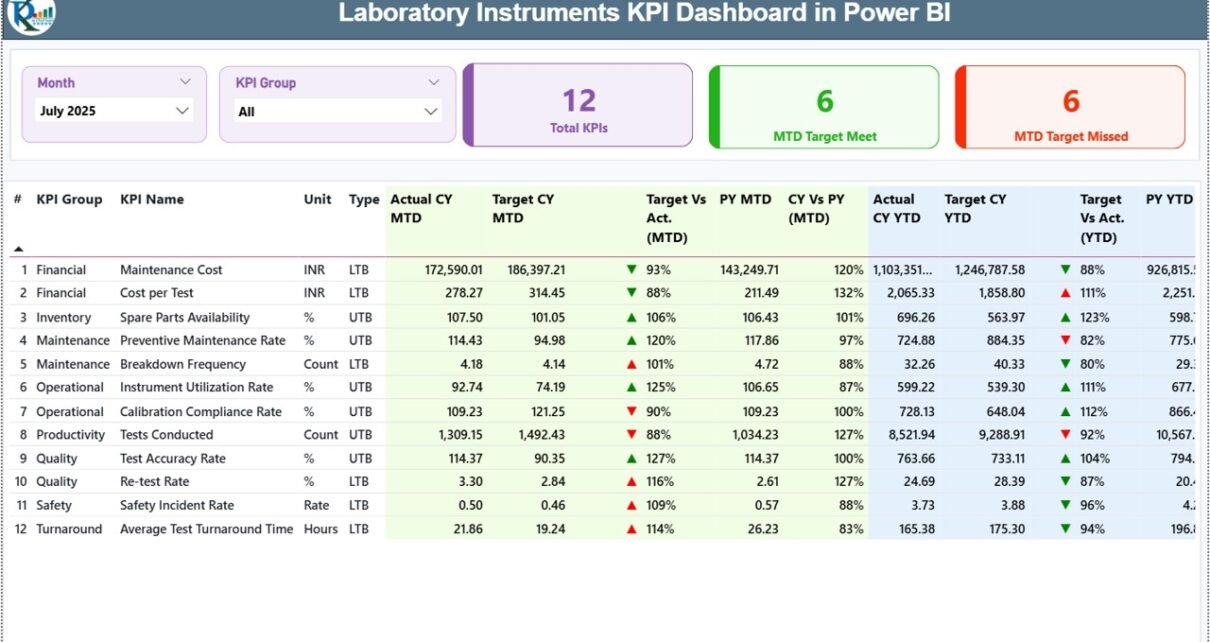
Laboratory Instruments KPI Dashboard in Power BI

February 11, 2026February 11, 2026 PKComments Off on Laboratory Instruments KPI Dashboard in Power BI
Laboratories depend on precision, speed, and compliance. However, many labs still track instrument performance manually. As a result, teams spend hours compiling reports. Moreover, managers struggle to monitor downtime, utilization
Read More
Dashboard Power BI

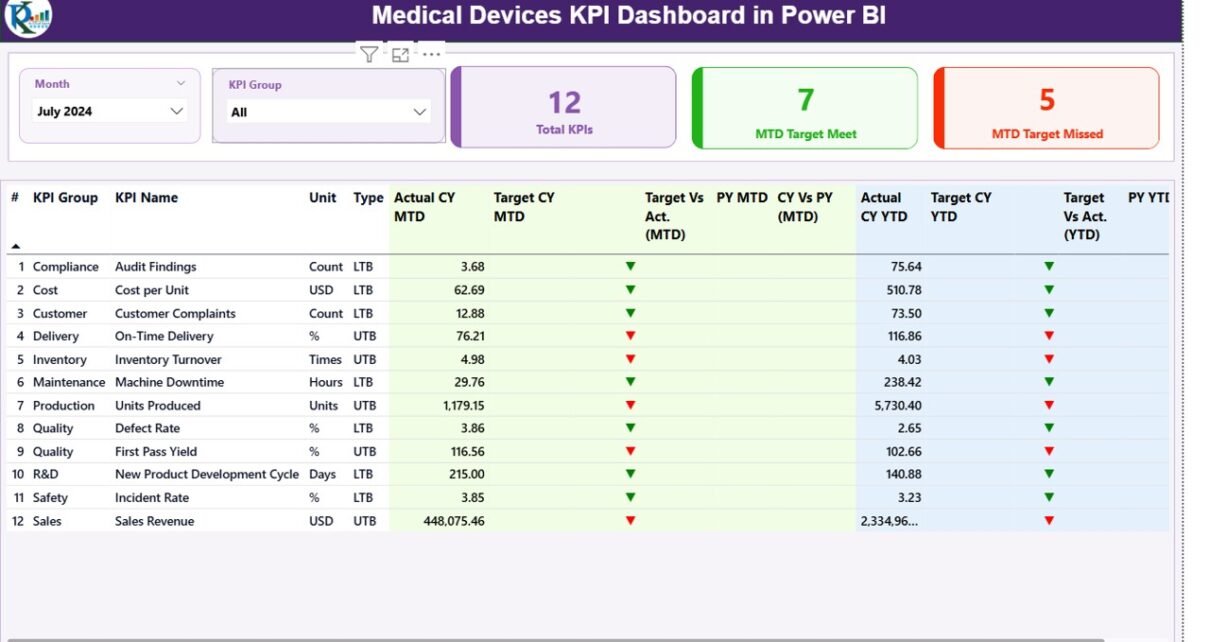
Medical Devices KPI Dashboard in Power BI

February 10, 2026February 10, 2026 PKComments Off on Medical Devices KPI Dashboard in Power BI
The medical devices industry demands precision, compliance, and consistent performance. Every month, teams monitor production output, defect rates, regulatory metrics, sales growth, and service performance. However, many organizations still rely
Read More
Dashboard Power BI

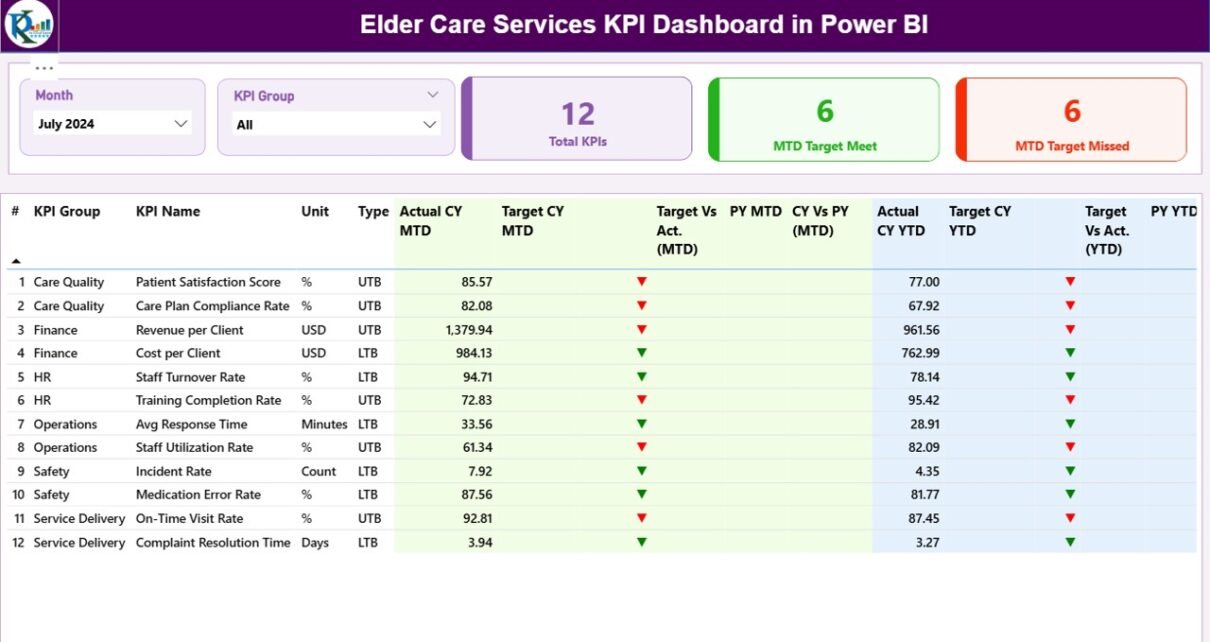
Elder Care Services KPI Dashboard in Power BI

January 26, 2026January 26, 2026 PKComments Off on Elder Care Services KPI Dashboard in Power BI
Managing elder care services requires accuracy, empathy, efficiency, and accountability. However, many elder care organizations still depend on manual reports, scattered Excel files, or delayed MIS updates. As a result,
Read More

Posts pagination

Previous 1 … 4 5 6 … 12 Next
  • Learn Excel (Free Course)
    • 1. Shortcut Keys
    • 2. Fill & Flash Fill
    • 3. Find & Replace
    • 4. Sort & Filter
    • 5. Formulas & Functions
    • 6. Data Validation
    • 7. Conditional Formatting
    • 8. Basic Charts
    • 9. Advanced Charts
    • 10. Pivot Tables
    • 11. Excel Dashboards
    • 12. VBA Course
    • 13. Excel Formulas with AI
  • Templates
  • Tutorials
    • Charts and Visualization
    • VBA
    • Excel Tips and Tricks
    • Excel Dashboards
    • Power Pivot & DAX
  • Power BI
  • Template Store
    • Ready to Use Templates
  • Courses
  • Academy
    • Excel + AI Mastery: 100 Formulas
    • Excel Pivot Tables & Dashboards
  • About Us
  • Contact Us
Copyright © 2023 PK-AnExcelExpert.com - Privacy Policy