New: NextGenTemplates Academy - video courses on Excel formulas with AI and Pivot Tables & dashboards. Early-bird: 20% off with code EARLYBIRD20 - first 20 orders only. See the courses →
  • Learn Excel (Free Course)
    • 1. Shortcut Keys
    • 2. Fill & Flash Fill
    • 3. Find & Replace
    • 4. Sort & Filter
    • 5. Formulas & Functions
    • 6. Data Validation
    • 7. Conditional Formatting
    • 8. Basic Charts
    • 9. Advanced Charts
    • 10. Pivot Tables
    • 11. Excel Dashboards
    • 12. VBA Course
    • 13. Excel Formulas with AI
  • Templates
  • Tutorials
    • Charts and Visualization
    • VBA
    • Excel Tips and Tricks
    • Excel Dashboards
    • Power Pivot & DAX
  • Power BI
  • Template Store
    • Ready to Use Templates
  • Courses
  • Academy
    • Excel + AI Mastery: 100 Formulas
    • Excel Pivot Tables & Dashboards
  • About Us
  • Contact Us

PK: An Excel Expert

Transforming Data into Decisions

Tag: Infrastructure KPI dashboard

Dashboard Power BI

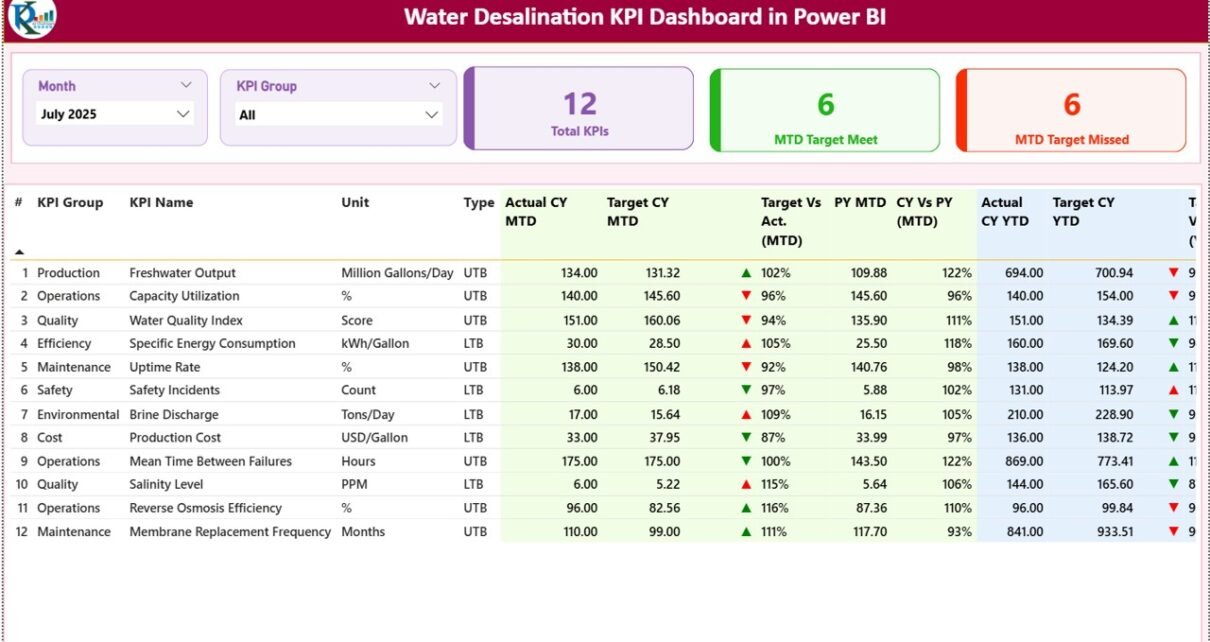
Water Desalination KPI Dashboard in Power BI

March 9, 2026March 9, 2026 PKComments Off on Water Desalination KPI Dashboard in Power BI
Water scarcity has become one of the biggest global challenges. As freshwater resources decrease, many countries depend on water desalination plants to convert seawater into usable drinking water. However, desalination
Read More
Dashboard

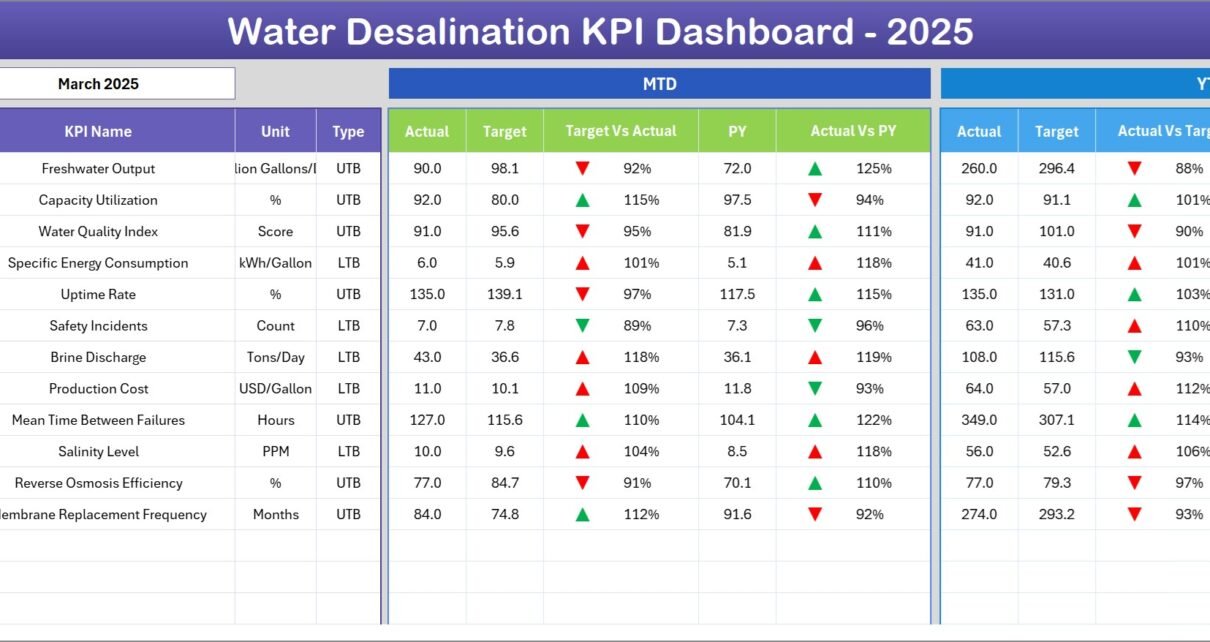
Water Desalination KPI Dashboard in Excel

March 9, 2026March 9, 2026 PKComments Off on Water Desalination KPI Dashboard in Excel
Freshwater scarcity continues to grow worldwide. Many countries now depend on water desalination plants to convert seawater into drinkable water. However, managing a desalination facility involves monitoring multiple operational and
Read More
Dashboard

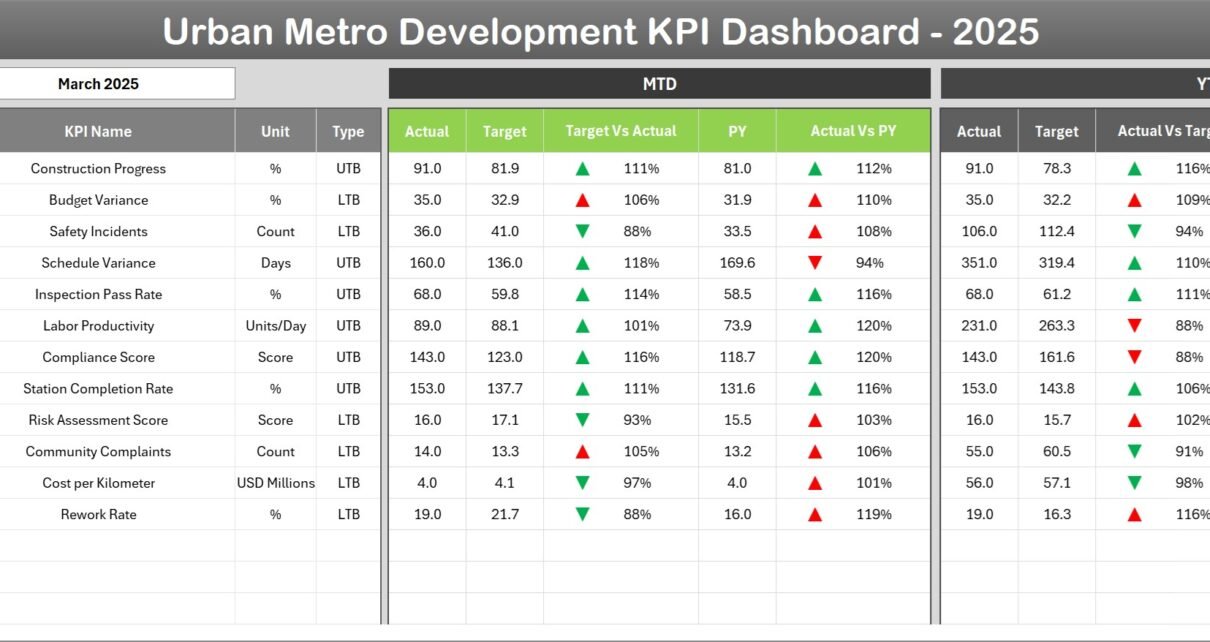
Urban Metro Development KPI Dashboard in Excel

March 8, 2026March 8, 2026 PKComments Off on Urban Metro Development KPI Dashboard in Excel
Urban metro systems play a crucial role in modern cities. As urban populations grow rapidly, governments and transportation authorities must manage complex metro infrastructure projects efficiently. These projects involve multiple
Read More
Dashboard Power BI

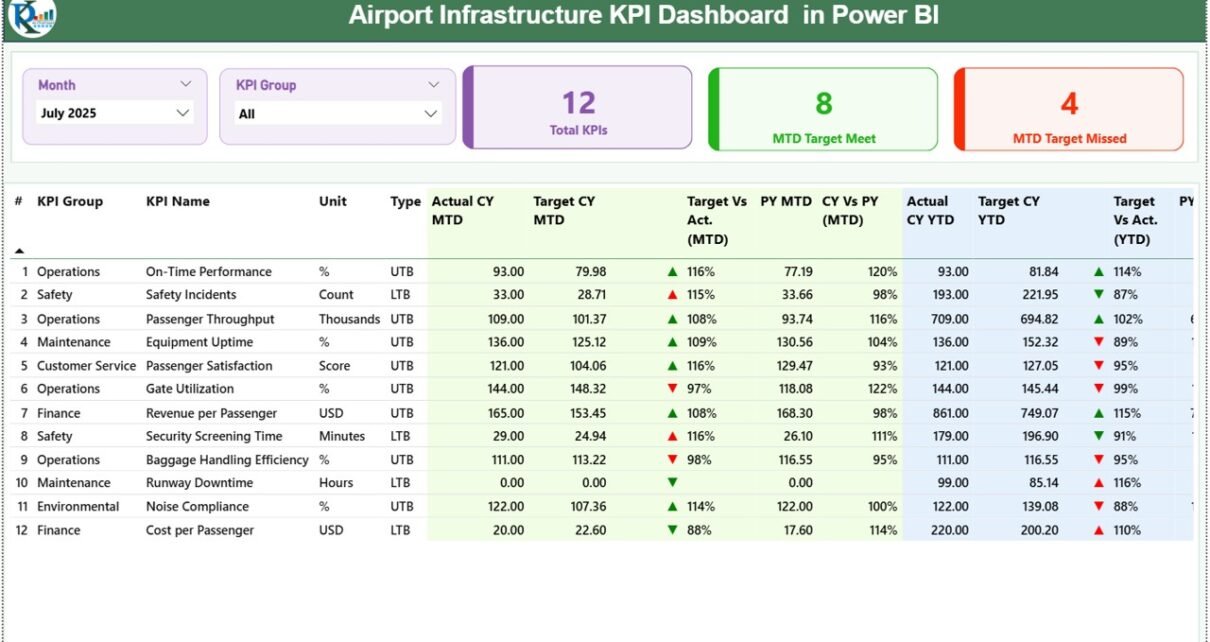
Airport Infrastructure KPI Dashboard in Power BI

March 7, 2026March 7, 2026 PKComments Off on Airport Infrastructure KPI Dashboard in Power BI
Airports operate as critical transportation hubs that connect people, businesses, and economies worldwide. Every day, airport authorities manage complex infrastructure such as runways, terminals, cargo facilities, security systems, and passenger
Read More
Dashboard

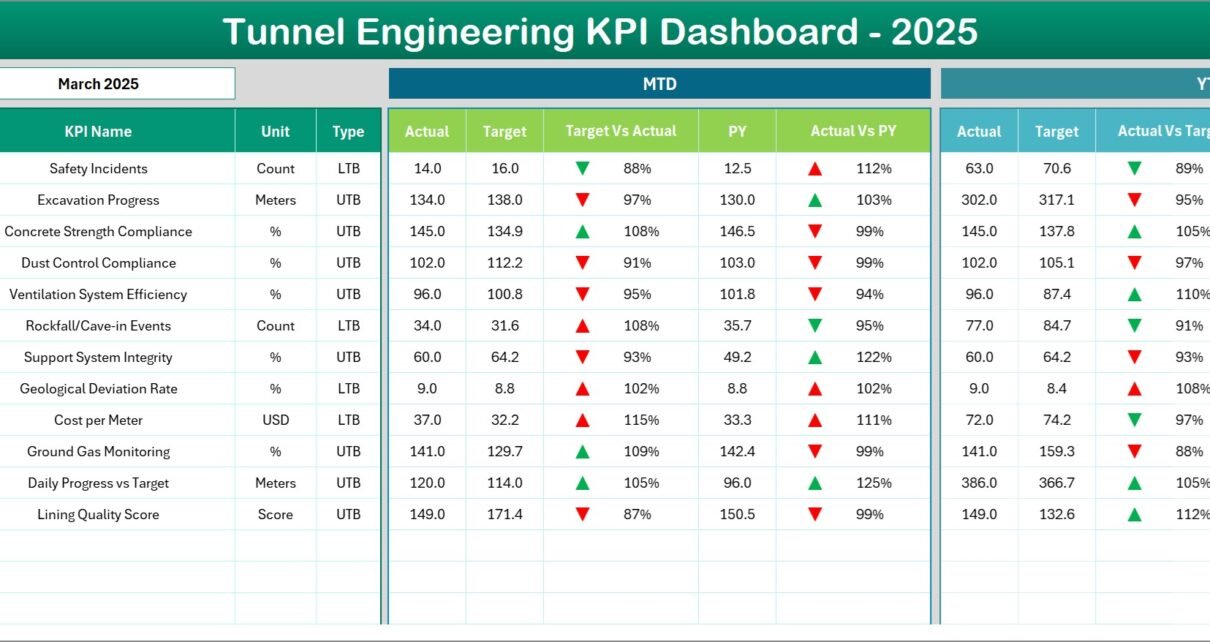
Tunnel Engineering KPI Dashboard in Excel

March 7, 2026March 7, 2026 PKComments Off on Tunnel Engineering KPI Dashboard in Excel
Tunnel engineering projects involve complex planning, strict safety standards, and continuous monitoring of construction activities. Engineers, project managers, and infrastructure authorities must track multiple performance indicators to ensure projects progress
Read More
Dashboard

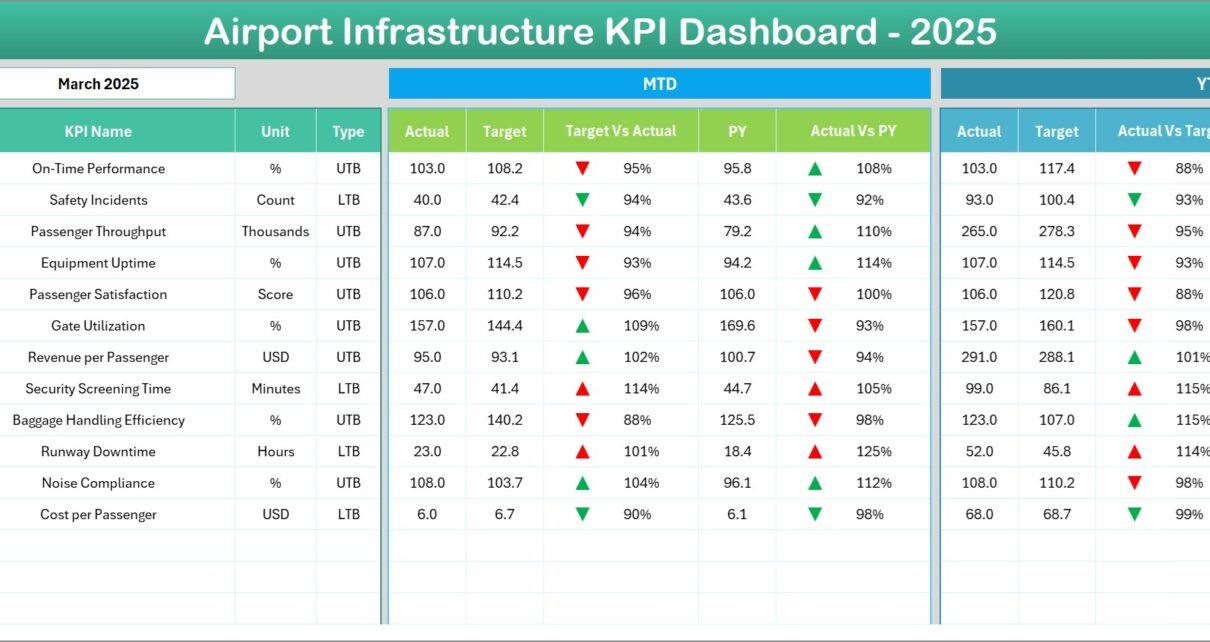
Airport Infrastructure KPI Dashboard in Excel

March 7, 2026March 7, 2026 PKComments Off on Airport Infrastructure KPI Dashboard in Excel
Airports operate as complex infrastructure hubs that connect cities, countries, and global trade routes. Every day, thousands of passengers, aircraft, and cargo shipments pass through airport facilities. Therefore, airport authorities
Read More
Dashboard

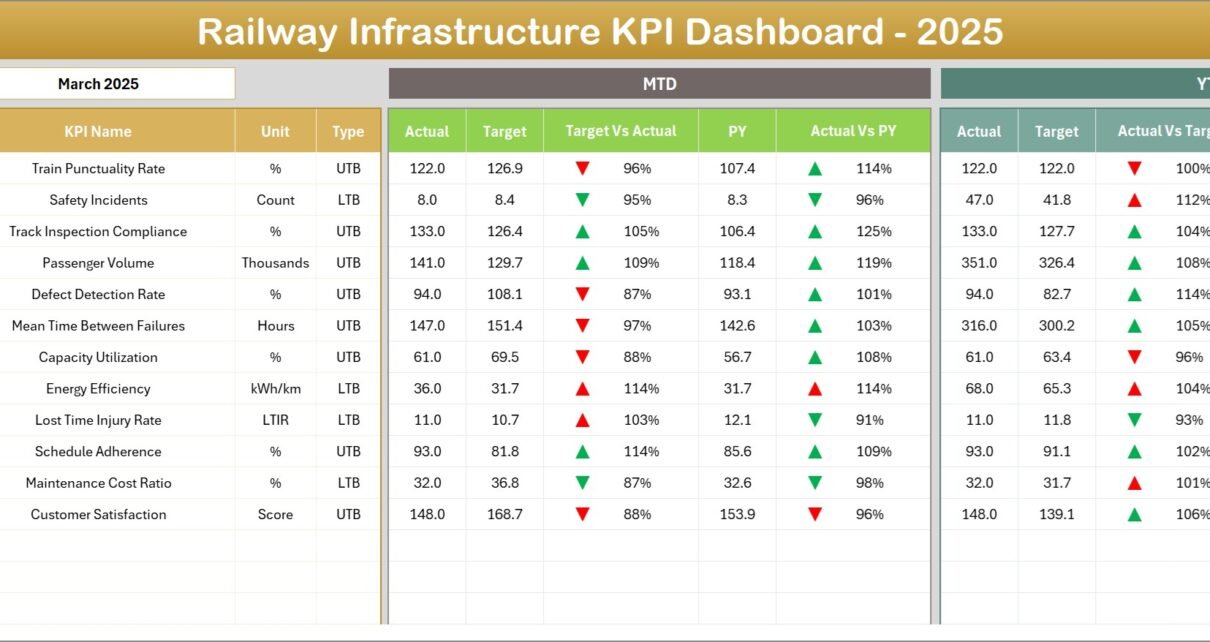
Railway Infrastructure KPI Dashboard in Excel

March 7, 2026March 7, 2026 PKComments Off on Railway Infrastructure KPI Dashboard in Excel
Railway infrastructure plays a vital role in transportation, logistics, and economic growth. Governments and railway authorities invest billions in building and maintaining rail networks, stations, tracks, and signaling systems. However,
Read More
Dashboard Power BI

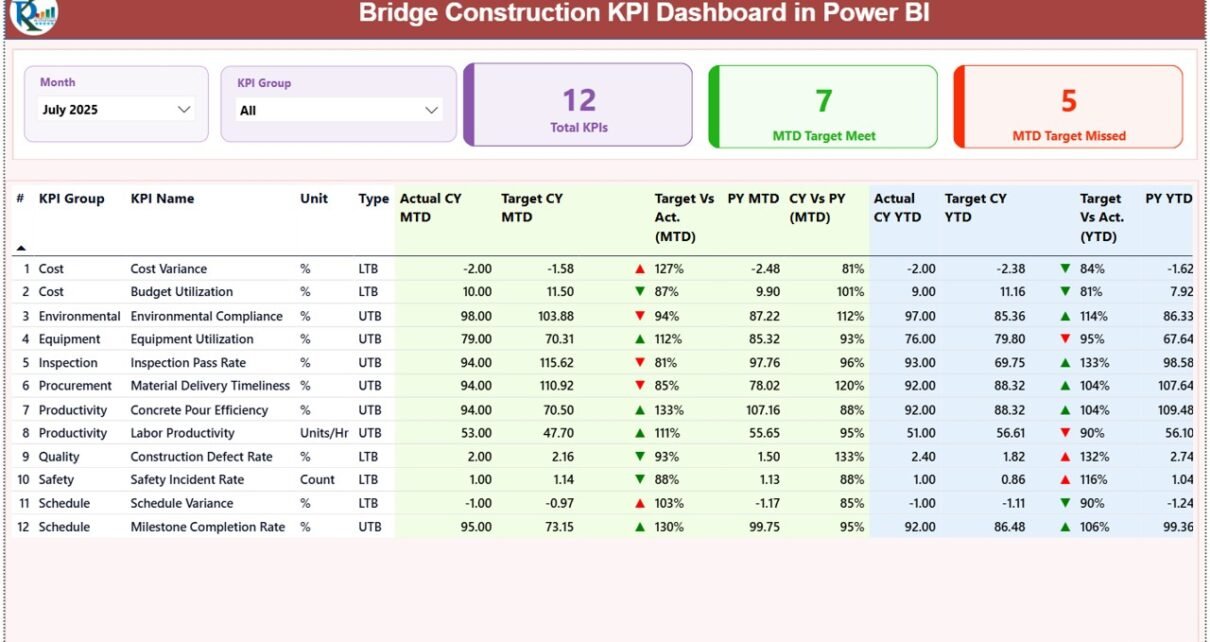
Bridge Construction KPI Dashboard in Power BI

March 6, 2026March 6, 2026 PKComments Off on Bridge Construction KPI Dashboard in Power BI
Bridge construction projects require precise planning, strict monitoring, and continuous performance tracking. However, many construction companies still rely on scattered spreadsheets and manual reports. As a result, project managers often
Read More
Dashboard Power BI

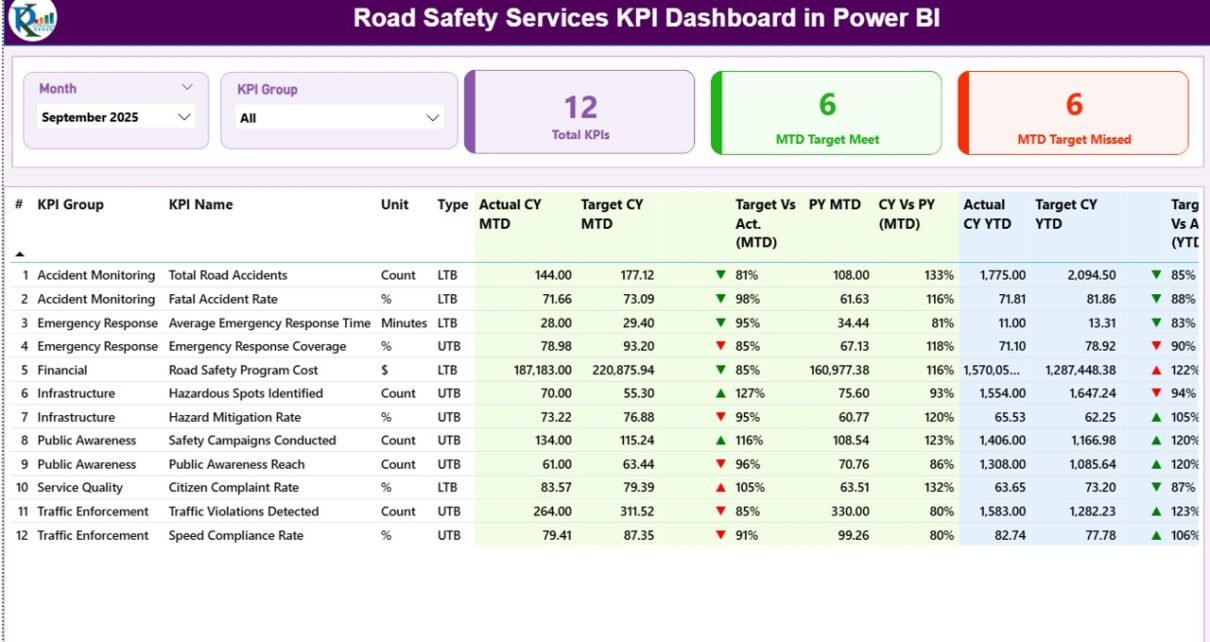
Road Safety Services KPI Dashboard in Power BI

March 6, 2026March 6, 2026 PKComments Off on Road Safety Services KPI Dashboard in Power BI
Road safety plays a crucial role in protecting lives, reducing accidents, and improving transportation systems. Governments, traffic departments, infrastructure agencies, and safety service providers constantly work to reduce road accidents,
Read More
Dashboard

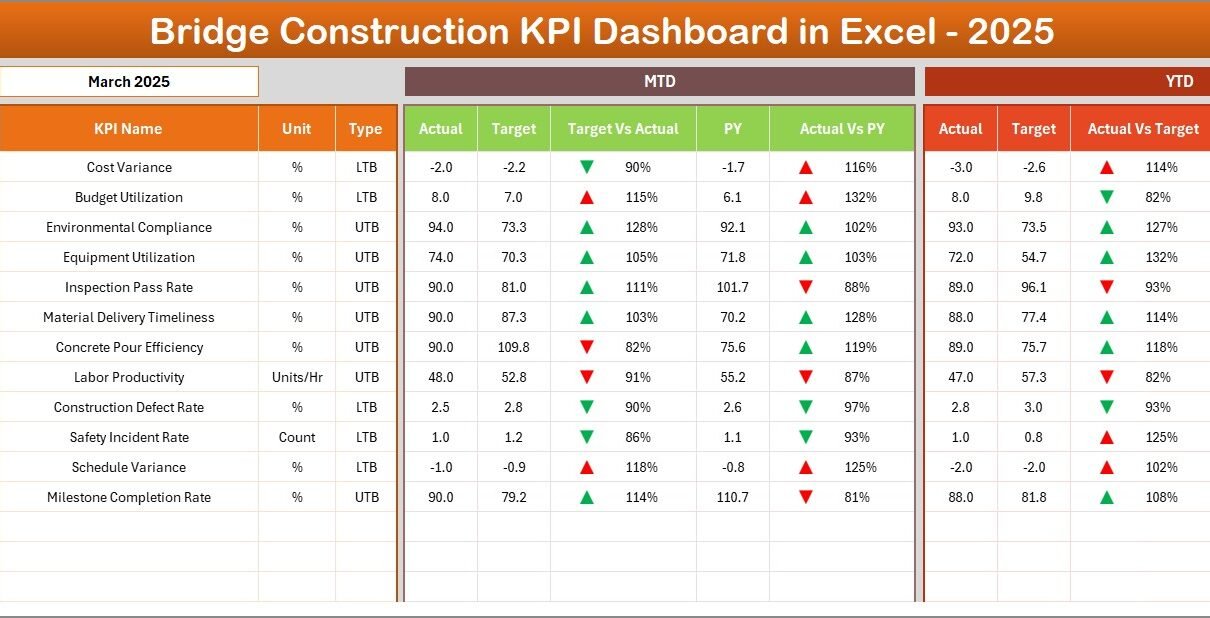
Bridge Construction KPI Dashboard in Excel

March 6, 2026March 6, 2026 PKComments Off on Bridge Construction KPI Dashboard in Excel
Bridge construction projects involve complex planning, strict safety regulations, budget management, and continuous monitoring of performance indicators. However, many construction companies still rely on scattered spreadsheets, manual reporting, and delayed
Read More

Posts pagination

1 2 Next
  • Learn Excel (Free Course)
    • 1. Shortcut Keys
    • 2. Fill & Flash Fill
    • 3. Find & Replace
    • 4. Sort & Filter
    • 5. Formulas & Functions
    • 6. Data Validation
    • 7. Conditional Formatting
    • 8. Basic Charts
    • 9. Advanced Charts
    • 10. Pivot Tables
    • 11. Excel Dashboards
    • 12. VBA Course
    • 13. Excel Formulas with AI
  • Templates
  • Tutorials
    • Charts and Visualization
    • VBA
    • Excel Tips and Tricks
    • Excel Dashboards
    • Power Pivot & DAX
  • Power BI
  • Template Store
    • Ready to Use Templates
  • Courses
  • Academy
    • Excel + AI Mastery: 100 Formulas
    • Excel Pivot Tables & Dashboards
  • About Us
  • Contact Us
Copyright © 2023 PK-AnExcelExpert.com - Privacy Policy