New: NextGenTemplates Academy - video courses on Excel formulas with AI and Pivot Tables & dashboards. Early-bird: 20% off with code EARLYBIRD20 - first 20 orders only. See the courses →
  • Learn Excel (Free Course)
    • 1. Shortcut Keys
    • 2. Fill & Flash Fill
    • 3. Find & Replace
    • 4. Sort & Filter
    • 5. Formulas & Functions
    • 6. Data Validation
    • 7. Conditional Formatting
    • 8. Basic Charts
    • 9. Advanced Charts
    • 10. Pivot Tables
    • 11. Excel Dashboards
    • 12. VBA Course
    • 13. Excel Formulas with AI
  • Templates
  • Tutorials
    • Charts and Visualization
    • VBA
    • Excel Tips and Tricks
    • Excel Dashboards
    • Power Pivot & DAX
  • Power BI
  • Template Store
    • Ready to Use Templates
  • Courses
  • Academy
    • Excel + AI Mastery: 100 Formulas
    • Excel Pivot Tables & Dashboards
  • About Us
  • Contact Us

PK: An Excel Expert

Transforming Data into Decisions

Tag: interactive dashboard

Excel Tips and Tricks

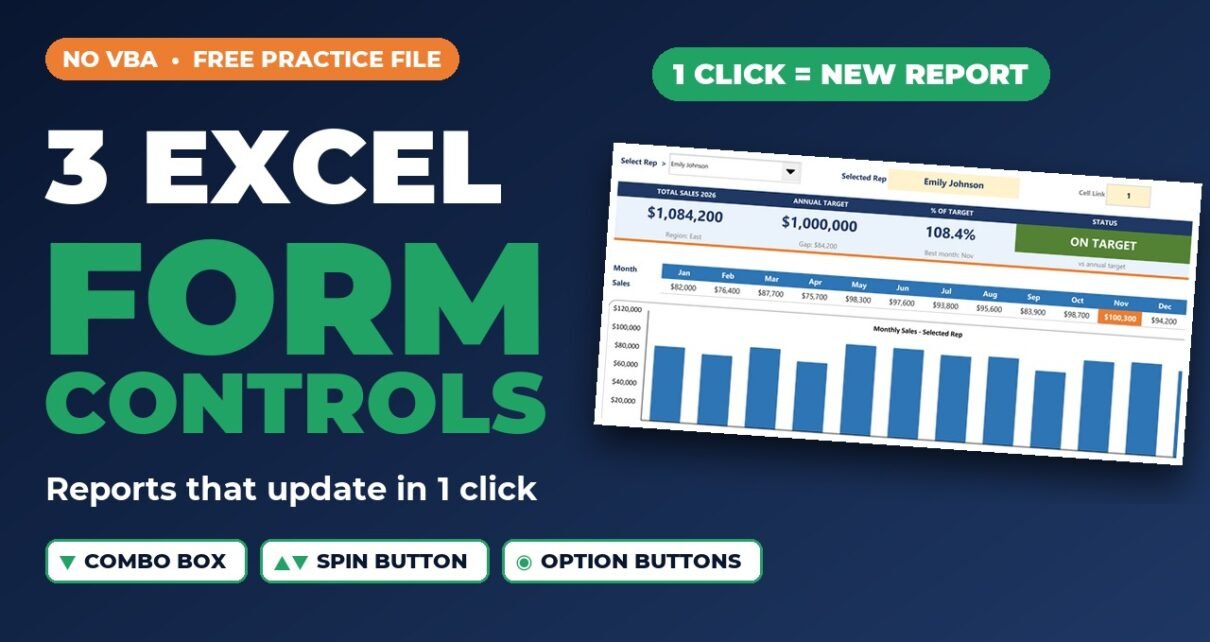
Excel Form Controls: Combo Box, Spin Button and Option Buttons (3 Real Business Examples)

September 29, 2026October 10, 2026 PKComments Off on Excel Form Controls: Combo Box, Spin Button and Option Buttons (3 Real Business Examples)
Excel form controls turn a static sheet into an interactive tool that anyone can use with a click. In this tutorial we solve three real business problems with the three
Read More
Dashboard Power BI

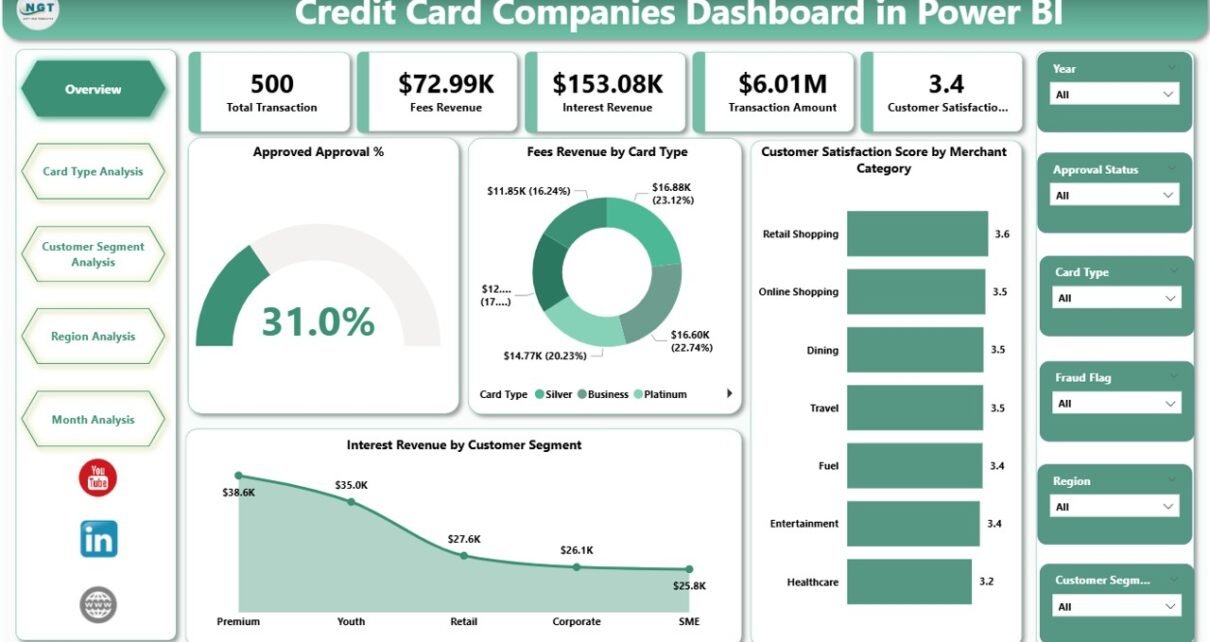
Credit Card Companies Dashboard in Power BI

February 26, 2026February 26, 2026 PKComments Off on Credit Card Companies Dashboard in Power BI
Modern financial institutions operate in a highly competitive and data-driven environment. Credit card companies process millions of transactions every day. Therefore, they must continuously monitor approvals, revenue streams, customer behavior,
Read More
Dashboard Power BI

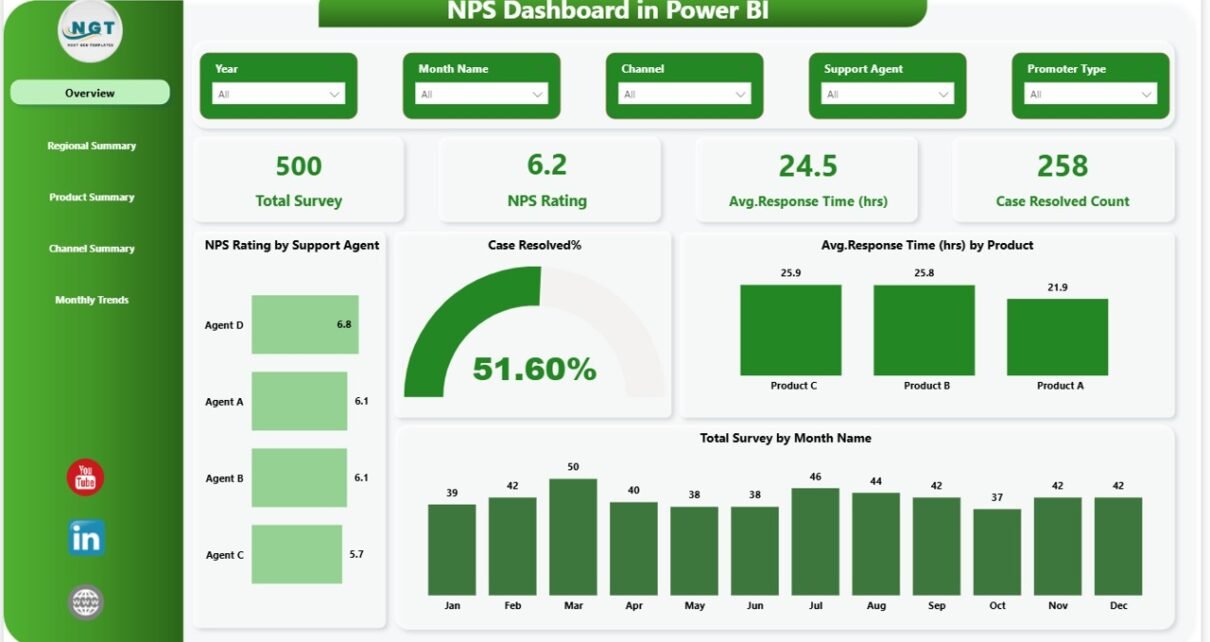
NPS Dashboard in Power BI

February 12, 2026February 12, 2026 PKComments Off on NPS Dashboard in Power BI
Customer loyalty decides business growth. However, many organizations still track customer feedback in scattered spreadsheets. As a result, leaders struggle to measure satisfaction, response time, and resolution rates clearly.So, how
Read More
Power BI

Broadcasting KPI Dashboard in Power BI

January 28, 2025April 8, 2025 PKComments Off on Broadcasting KPI Dashboard in Power BI
In today’s data-driven world, tracking Key Performance Indicators (KPIs) is crucial for broadcasting companies. KPIs provide insights into operational efficiency, audience engagement, and overall success. To streamline KPI tracking, Power
Read More
Power BI

Printing & Publishing KPI Dashboard in Power BI

January 27, 2025April 9, 2025 PKComments Off on Printing & Publishing KPI Dashboard in Power BI
The Printing & Publishing KPI Dashboard in Power BI is an essential tool for businesses in the printing and publishing industry. It helps track and manage key performance indicators (KPIs)
Read More
Power BI

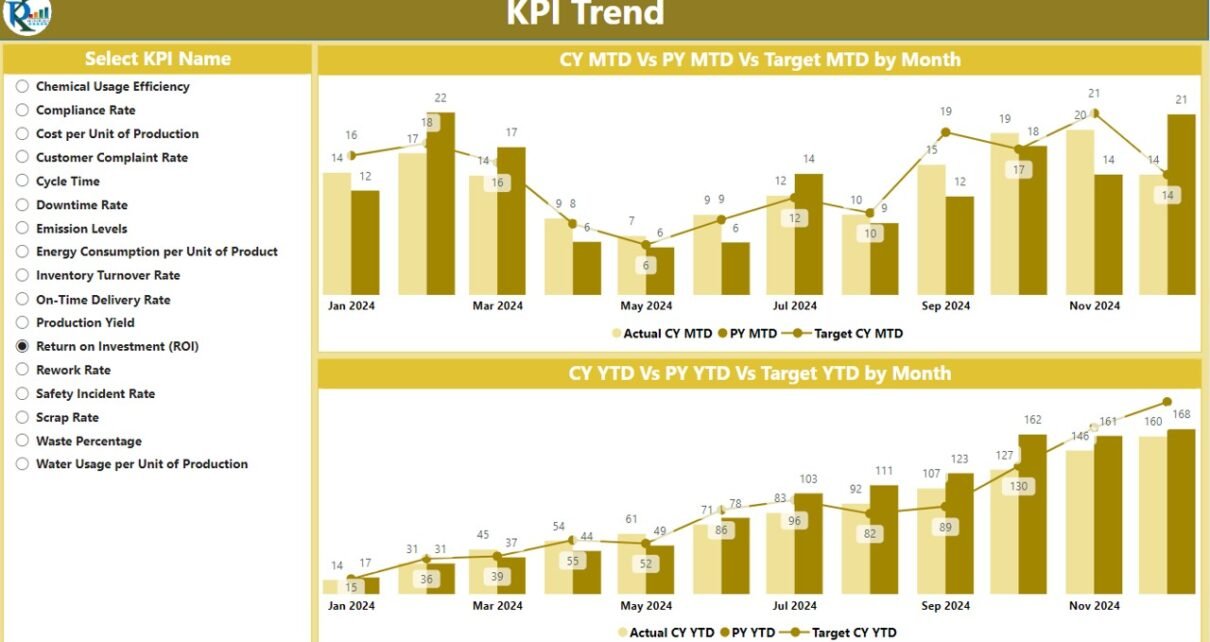
Chemical KPI Dashboard in Power BI

January 15, 2025February 24, 2025 PKComments Off on Chemical KPI Dashboard in Power BI
In today's world, data is a crucial asset for making informed business decisions. Especially in the chemical industry, where tracking performance through Key Performance Indicators (KPIs) plays a pivotal role
Read More
Power BI

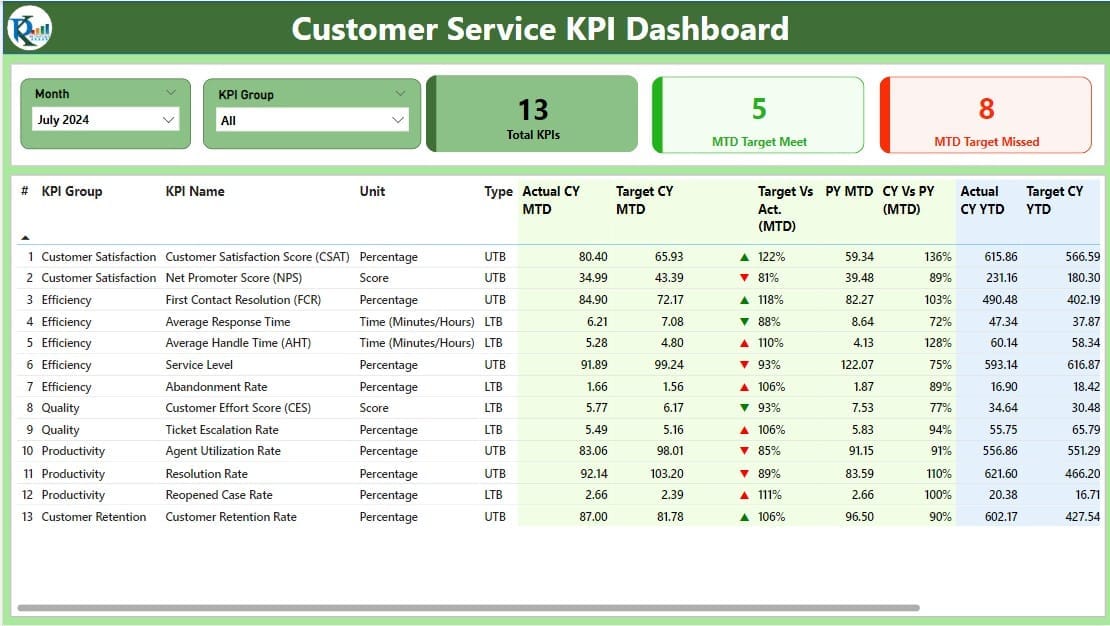
Customer Service KPI Dashboard in Power BI

December 8, 2024March 4, 2025 PKComments Off on Customer Service KPI Dashboard in Power BI
Managing customer service performance effectively is crucial for any business striving to improve customer satisfaction and overall efficiency. A Customer Service KPI Dashboard in Power BI is an excellent tool
Read More
Power BI

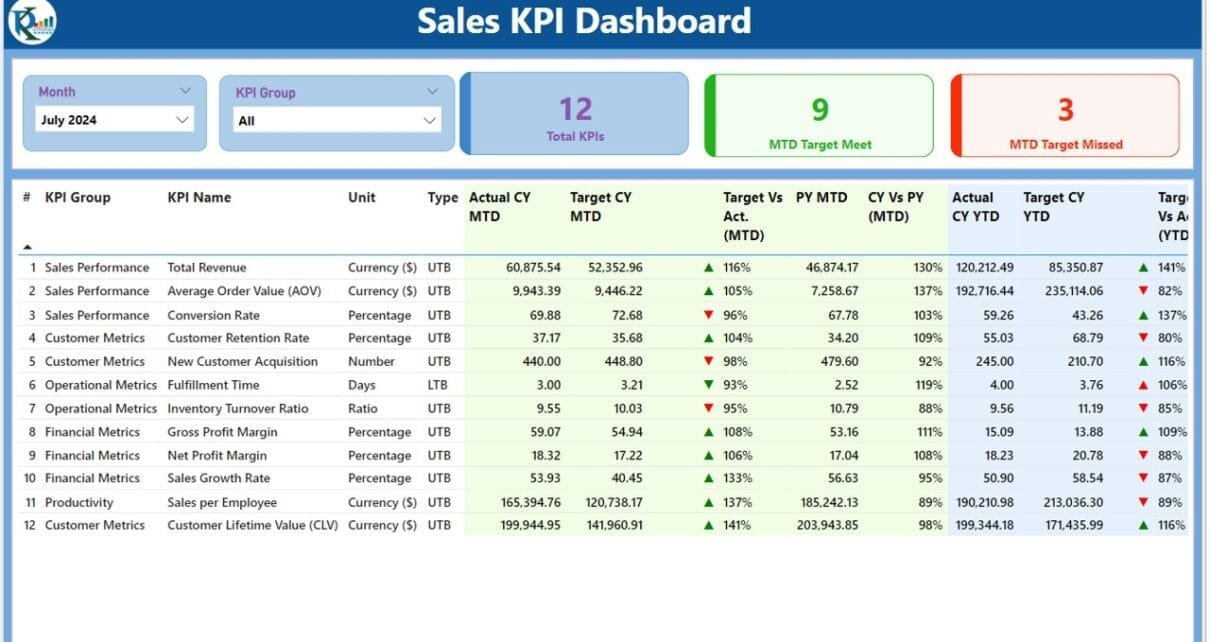
Sales KPI Dashboard in Power BI

December 4, 2024March 3, 2025 PKComments Off on Sales KPI Dashboard in Power BI
Power BI is a powerful tool for data visualization and performance tracking, and creating a Sales KPI Dashboard in Power BI can transform how you monitor your sales performance. This
Read More
  • Learn Excel (Free Course)
    • 1. Shortcut Keys
    • 2. Fill & Flash Fill
    • 3. Find & Replace
    • 4. Sort & Filter
    • 5. Formulas & Functions
    • 6. Data Validation
    • 7. Conditional Formatting
    • 8. Basic Charts
    • 9. Advanced Charts
    • 10. Pivot Tables
    • 11. Excel Dashboards
    • 12. VBA Course
    • 13. Excel Formulas with AI
  • Templates
  • Tutorials
    • Charts and Visualization
    • VBA
    • Excel Tips and Tricks
    • Excel Dashboards
    • Power Pivot & DAX
  • Power BI
  • Template Store
    • Ready to Use Templates
  • Courses
  • Academy
    • Excel + AI Mastery: 100 Formulas
    • Excel Pivot Tables & Dashboards
  • About Us
  • Contact Us
Copyright © 2023 PK-AnExcelExpert.com - Privacy Policy