New: NextGenTemplates Academy - video courses on Excel formulas with AI and Pivot Tables & dashboards. Early-bird: 20% off with code EARLYBIRD20 - first 20 orders only. See the courses →
  • Learn Excel (Free Course)
    • 1. Shortcut Keys
    • 2. Fill & Flash Fill
    • 3. Find & Replace
    • 4. Sort & Filter
    • 5. Formulas & Functions
    • 6. Data Validation
    • 7. Conditional Formatting
    • 8. Basic Charts
    • 9. Advanced Charts
    • 10. Pivot Tables
    • 11. Excel Dashboards
    • 12. VBA Course
    • 13. Excel Formulas with AI
  • Templates
  • Tutorials
    • Charts and Visualization
    • VBA
    • Excel Tips and Tricks
    • Excel Dashboards
    • Power Pivot & DAX
  • Power BI
  • Template Store
    • Ready to Use Templates
  • Courses
  • Academy
    • Excel + AI Mastery: 100 Formulas
    • Excel Pivot Tables & Dashboards
  • About Us
  • Contact Us

PK: An Excel Expert

Transforming Data into Decisions

Tag: Investment Dashboard

Dashboard Power BI

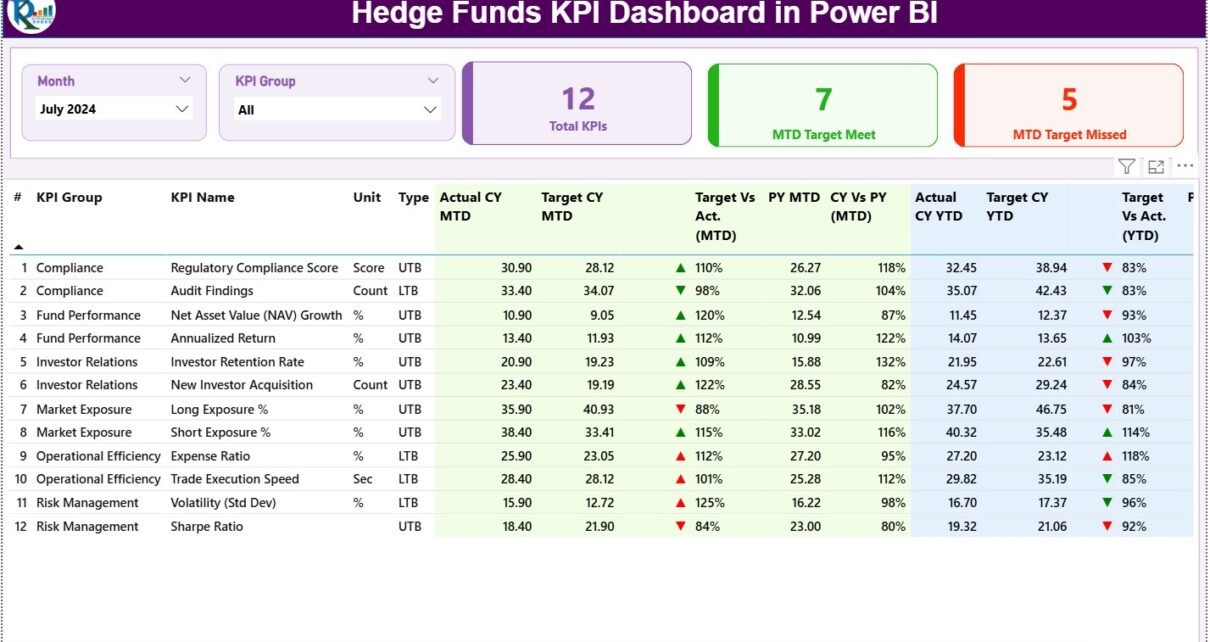
Hedge Funds KPI Dashboard in Power BI

November 17, 2025November 17, 2025 PKComments Off on Hedge Funds KPI Dashboard in Power BI
A Hedge Funds KPI Dashboard in Power BI is a ready-to-use, interactive reporting system designed to measure key investment performance indicators across multiple funds. It gives you a clear view
Read More
Dashboard

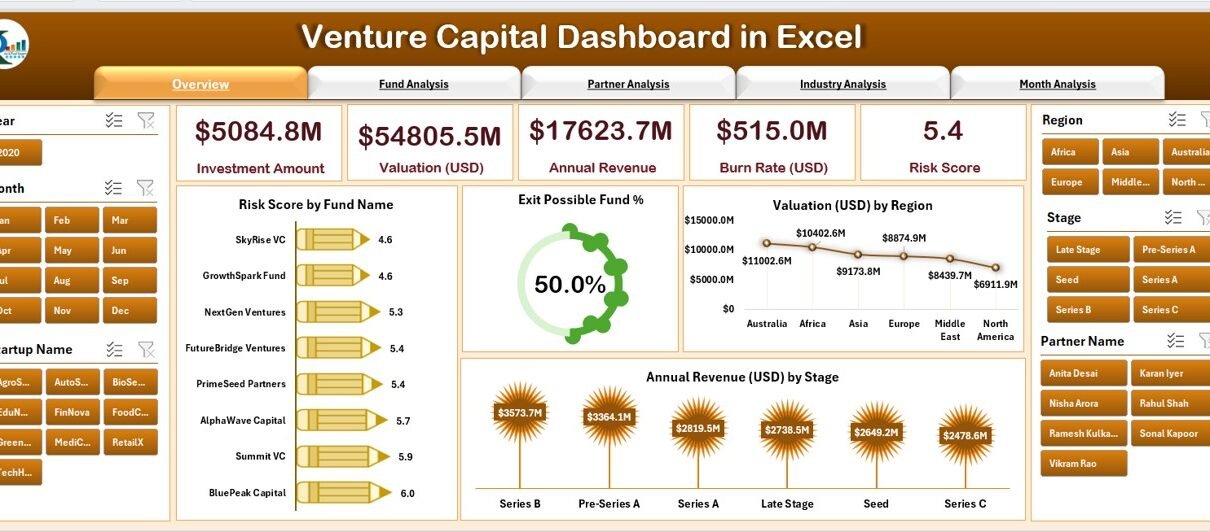
Venture Capital Dashboard in Excel

November 16, 2025November 16, 2025 PKComments Off on Venture Capital Dashboard in Excel
Venture capital teams handle high-value investments, portfolio risks, fund performance tracking, partner reviews, and industry trend analysis every day. Because of this, they need a clear and organized way to
Read More
Dashboard

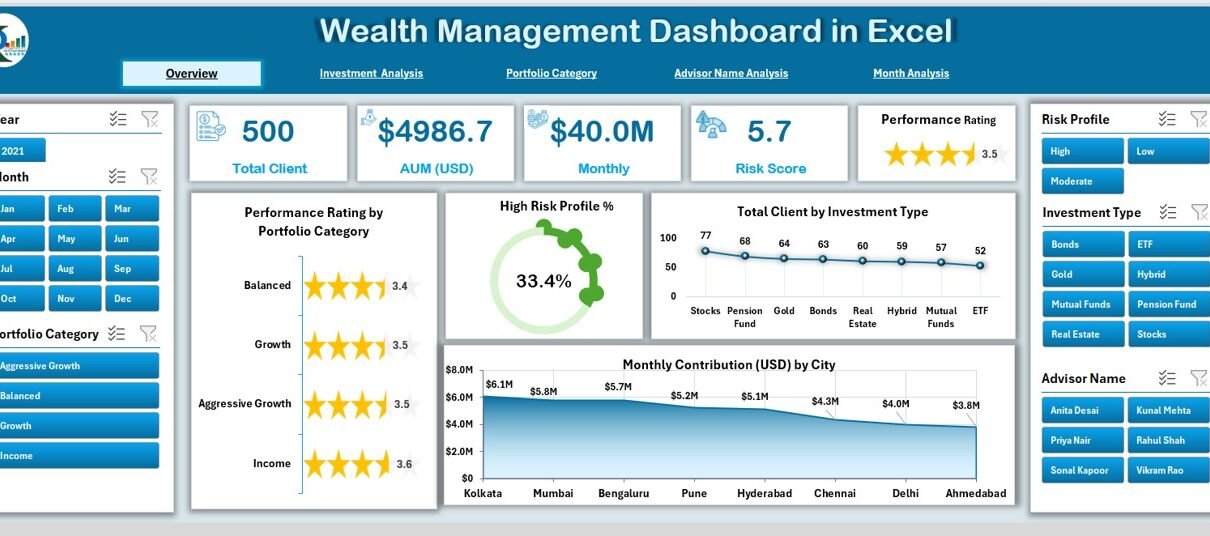
Wealth Management Dashboard in Excel

November 15, 2025November 15, 2025 PKComments Off on Wealth Management Dashboard in Excel
Managing wealth becomes easier when you track every investment, every contribution, and every performance indicator in one place. Yet, many individuals, financial advisors, and wealth managers still use scattered sheets,
Read More
Dashboard

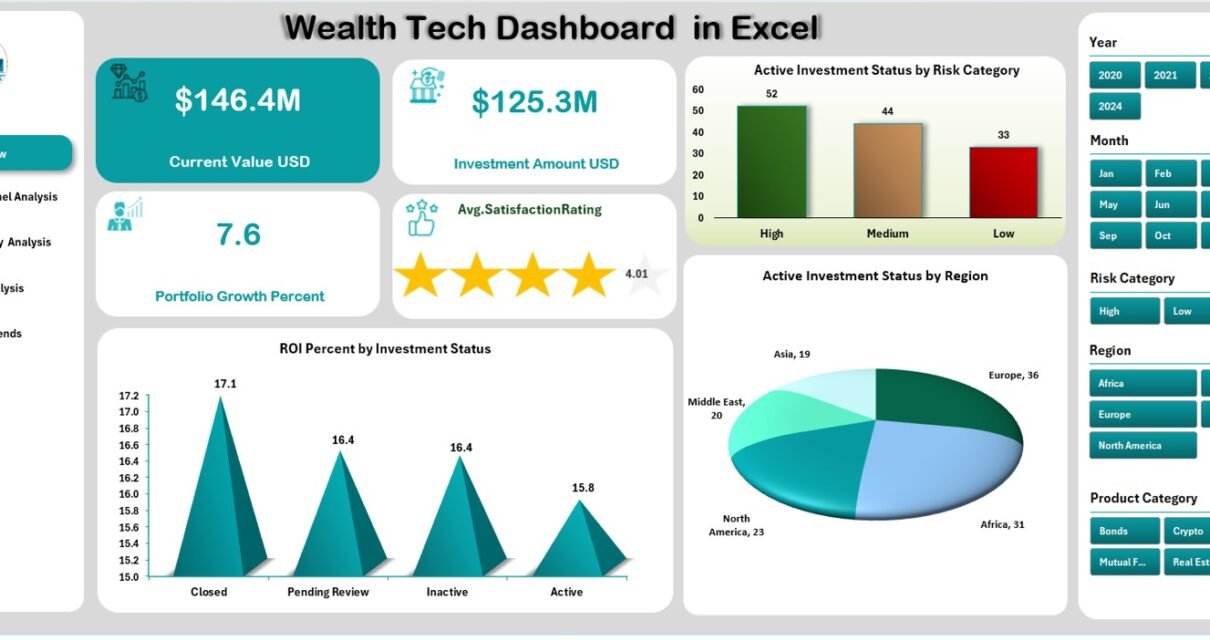
Wealth Tech Dashboard in Excel

November 5, 2025November 5, 2025 PKComments Off on Wealth Tech Dashboard in Excel
In today’s data-driven financial world, investment decisions depend on analytics, not assumptions. Whether you are a wealth manager, financial consultant, or independent investor, understanding your investment performance in real-time makes
Read More

Posts pagination

Previous 1 2
  • Learn Excel (Free Course)
    • 1. Shortcut Keys
    • 2. Fill & Flash Fill
    • 3. Find & Replace
    • 4. Sort & Filter
    • 5. Formulas & Functions
    • 6. Data Validation
    • 7. Conditional Formatting
    • 8. Basic Charts
    • 9. Advanced Charts
    • 10. Pivot Tables
    • 11. Excel Dashboards
    • 12. VBA Course
    • 13. Excel Formulas with AI
  • Templates
  • Tutorials
    • Charts and Visualization
    • VBA
    • Excel Tips and Tricks
    • Excel Dashboards
    • Power Pivot & DAX
  • Power BI
  • Template Store
    • Ready to Use Templates
  • Courses
  • Academy
    • Excel + AI Mastery: 100 Formulas
    • Excel Pivot Tables & Dashboards
  • About Us
  • Contact Us
Copyright © 2023 PK-AnExcelExpert.com - Privacy Policy