New: NextGenTemplates Academy - video courses on Excel formulas with AI and Pivot Tables & dashboards. Early-bird: 20% off with code EARLYBIRD20 - first 20 orders only. See the courses →
  • Learn Excel (Free Course)
    • 1. Shortcut Keys
    • 2. Fill & Flash Fill
    • 3. Find & Replace
    • 4. Sort & Filter
    • 5. Formulas & Functions
    • 6. Data Validation
    • 7. Conditional Formatting
    • 8. Basic Charts
    • 9. Advanced Charts
    • 10. Pivot Tables
    • 11. Excel Dashboards
    • 12. VBA Course
    • 13. Excel Formulas with AI
  • Templates
  • Tutorials
    • Charts and Visualization
    • VBA
    • Excel Tips and Tricks
    • Excel Dashboards
    • Power Pivot & DAX
  • Power BI
  • Template Store
    • Ready to Use Templates
  • Courses
  • Academy
    • Excel + AI Mastery: 100 Formulas
    • Excel Pivot Tables & Dashboards
  • About Us
  • Contact Us

PK: An Excel Expert

Transforming Data into Decisions

Tag: Investment management

Dashboard

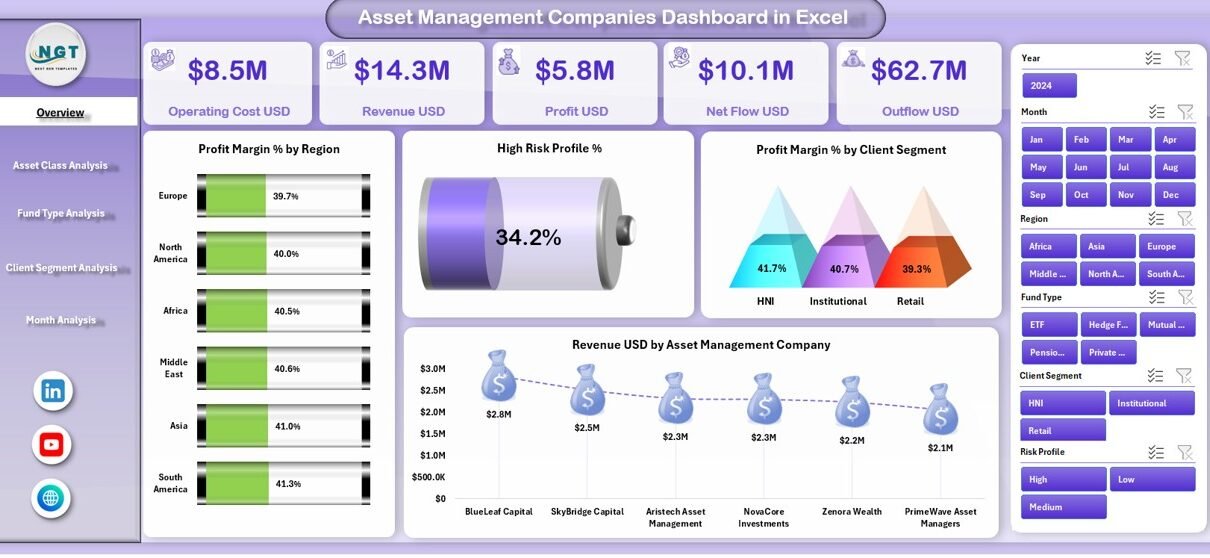
Asset Management Companies Dashboard in Excel

December 15, 2025December 15, 2025 PKComments Off on Asset Management Companies Dashboard in Excel
Managing investments across asset classes, funds, client segments, and time periods demands accuracy, clarity, and speed. However, many asset management companies still rely on scattered spreadsheets, static reports, and manual
Read More
Power BI

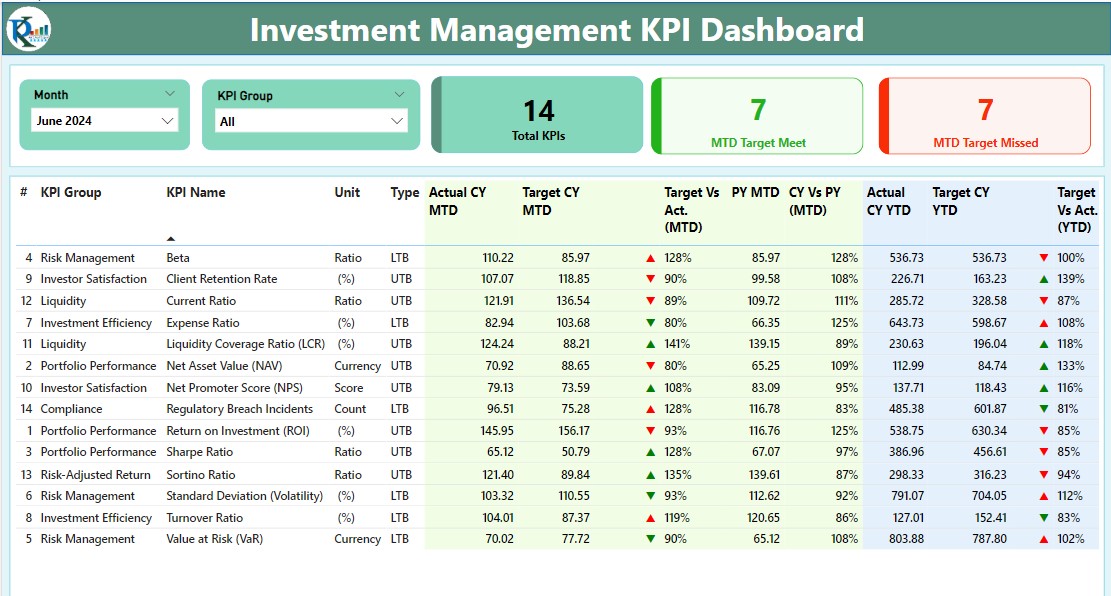
Investment Management KPI Dashboard in Power BI

December 24, 2024March 11, 2025 PKComments Off on Investment Management KPI Dashboard in Power BI
In the fast-paced world of investment management, staying ahead means leveraging the right tools to monitor performance and make data-driven decisions swiftly. Power BI, a powerful data visualization tool, offers
Read More
Dashboard

Investment Management KPI Dashboard in Excel

October 25, 2024March 16, 2025 PKComments Off on Investment Management KPI Dashboard in Excel
Managing investments effectively requires detailed insights into performance metrics, historical comparisons, and future targets. For investment managers, tracking these details across multiple KPIs can be a daunting task. This is
Read More
  • Learn Excel (Free Course)
    • 1. Shortcut Keys
    • 2. Fill & Flash Fill
    • 3. Find & Replace
    • 4. Sort & Filter
    • 5. Formulas & Functions
    • 6. Data Validation
    • 7. Conditional Formatting
    • 8. Basic Charts
    • 9. Advanced Charts
    • 10. Pivot Tables
    • 11. Excel Dashboards
    • 12. VBA Course
    • 13. Excel Formulas with AI
  • Templates
  • Tutorials
    • Charts and Visualization
    • VBA
    • Excel Tips and Tricks
    • Excel Dashboards
    • Power Pivot & DAX
  • Power BI
  • Template Store
    • Ready to Use Templates
  • Courses
  • Academy
    • Excel + AI Mastery: 100 Formulas
    • Excel Pivot Tables & Dashboards
  • About Us
  • Contact Us
Copyright © 2023 PK-AnExcelExpert.com - Privacy Policy