New: NextGenTemplates Academy - video courses on Excel formulas with AI and Pivot Tables & dashboards. Early-bird: 20% off with code EARLYBIRD20 - first 20 orders only. See the courses →
  • Learn Excel (Free Course)
    • 1. Shortcut Keys
    • 2. Fill & Flash Fill
    • 3. Find & Replace
    • 4. Sort & Filter
    • 5. Formulas & Functions
    • 6. Data Validation
    • 7. Conditional Formatting
    • 8. Basic Charts
    • 9. Advanced Charts
    • 10. Pivot Tables
    • 11. Excel Dashboards
    • 12. VBA Course
    • 13. Excel Formulas with AI
  • Templates
  • Tutorials
    • Charts and Visualization
    • VBA
    • Excel Tips and Tricks
    • Excel Dashboards
    • Power Pivot & DAX
  • Power BI
  • Template Store
    • Ready to Use Templates
  • Courses
  • Academy
    • Excel + AI Mastery: 100 Formulas
    • Excel Pivot Tables & Dashboards
  • About Us
  • Contact Us

PK: An Excel Expert

Transforming Data into Decisions

Tag: KPI Dashboard

Dashboard

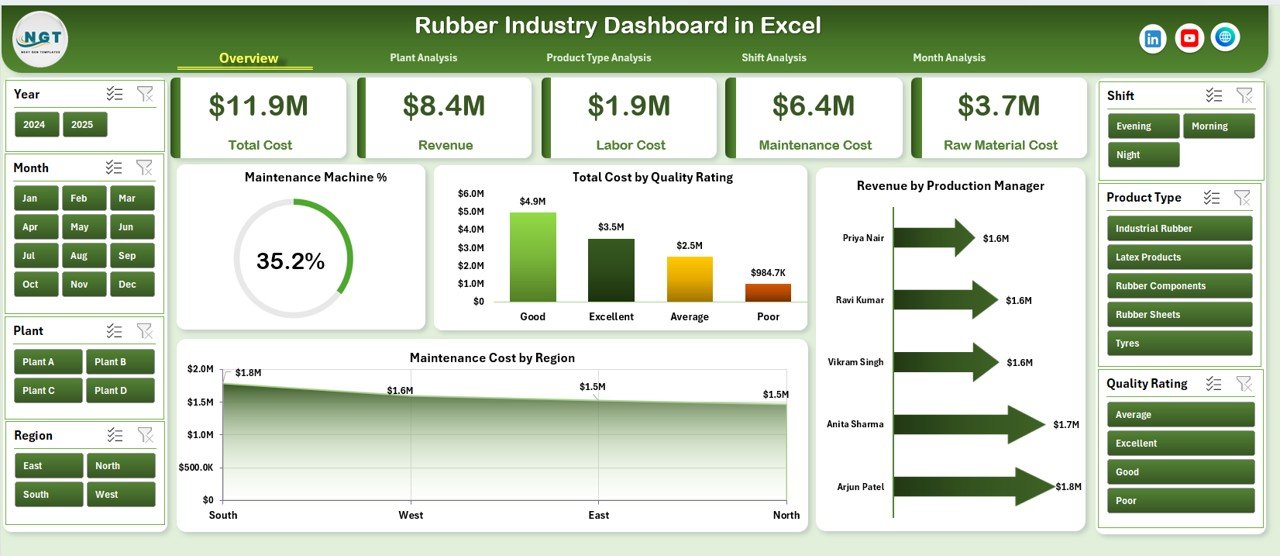
Rubber Industry Dashboard in Excel

February 12, 2026February 12, 2026 PKComments Off on Rubber Industry Dashboard in Excel
The rubber industry runs on precision, cost control, and production efficiency. However, many rubber manufacturers still depend on scattered spreadsheets. As a result, leaders struggle to monitor plant performance, labor
Read More
Dashboard Power BI

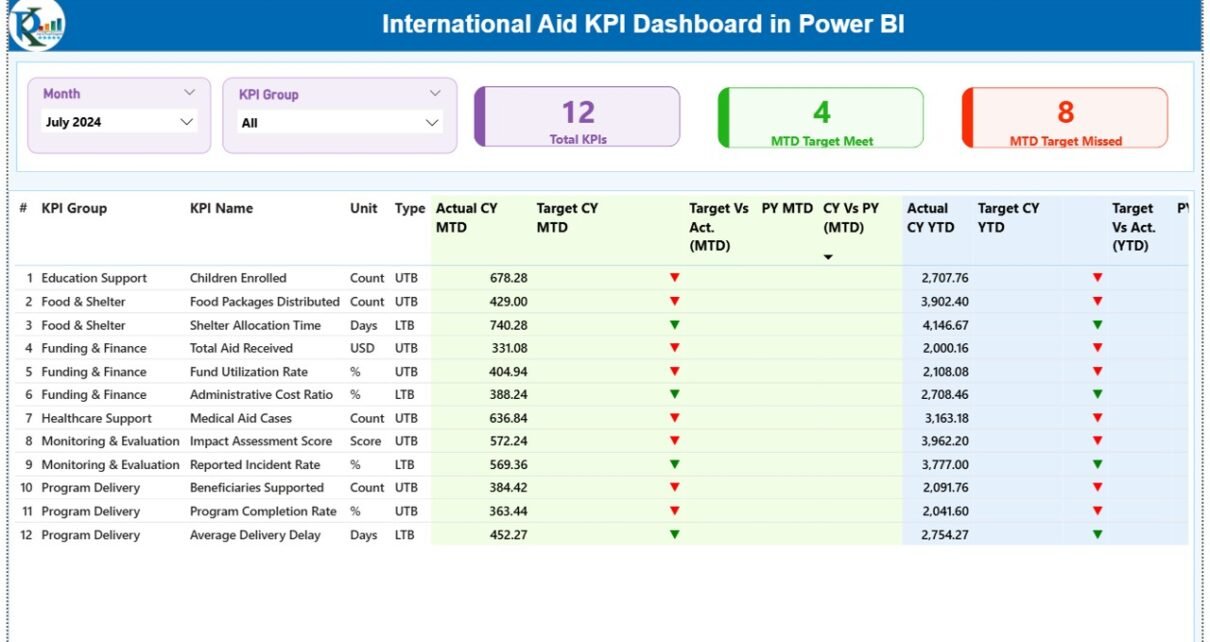
International Aid KPI Dashboard in Power BI

February 12, 2026February 12, 2026 PKComments Off on International Aid KPI Dashboard in Power BI
International aid organizations manage millions of dollars, thousands of beneficiaries, and multiple programs across regions. However, many teams still rely on scattered spreadsheets and manual reports. As a result, leaders
Read More
Dashboard Power BI

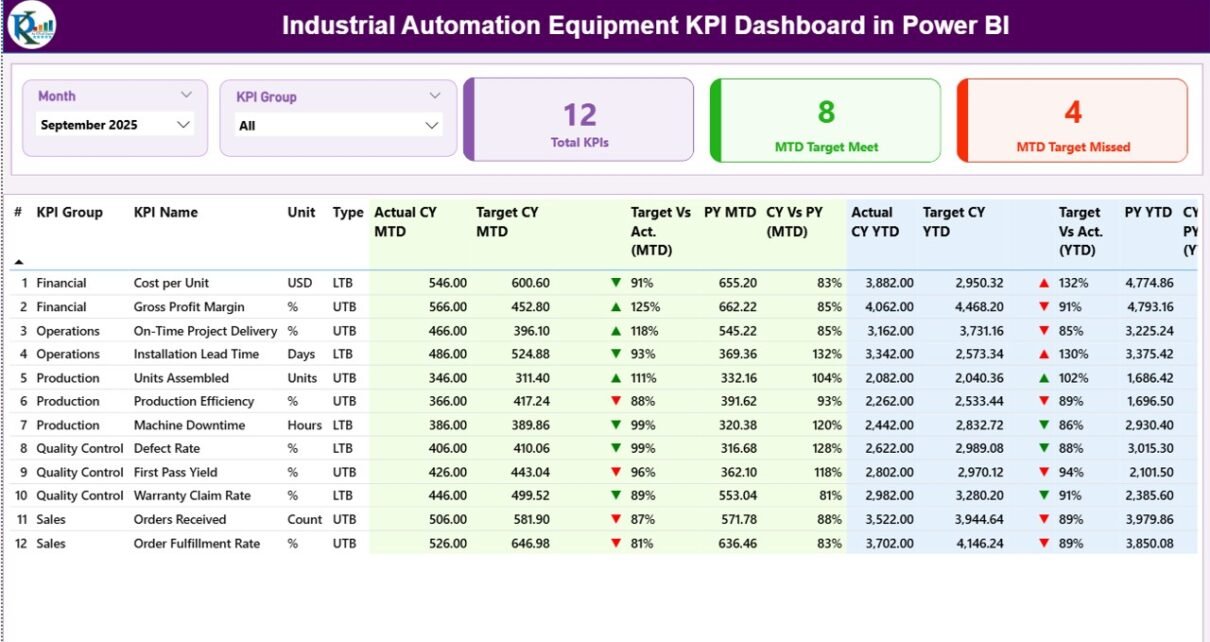
Industrial Automation Equipment KPI Dashboard in Power BI

February 10, 2026February 10, 2026 PKComments Off on Industrial Automation Equipment KPI Dashboard in Power BI
Industrial automation drives modern manufacturing. However, without proper performance tracking, even advanced machines fail to deliver full value. Companies invest heavily in PLC systems, robotics, SCADA, sensors, and automated production
Read More
Dashboard

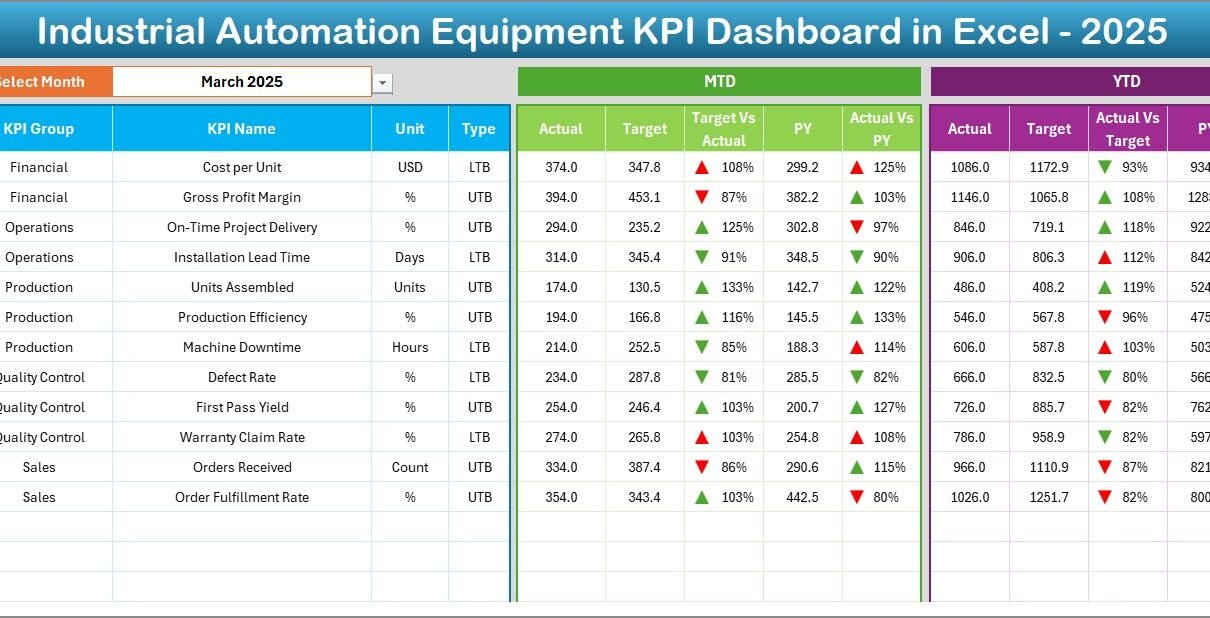
Industrial Automation Equipment KPI Dashboard in Excel

February 10, 2026February 10, 2026 PKComments Off on Industrial Automation Equipment KPI Dashboard in Excel
Industrial automation drives modern manufacturing. However, many companies still struggle to track machine efficiency, downtime, production output, and maintenance costs in one structured system. As a result, managers rely on
Read More
Dashboard Power BI

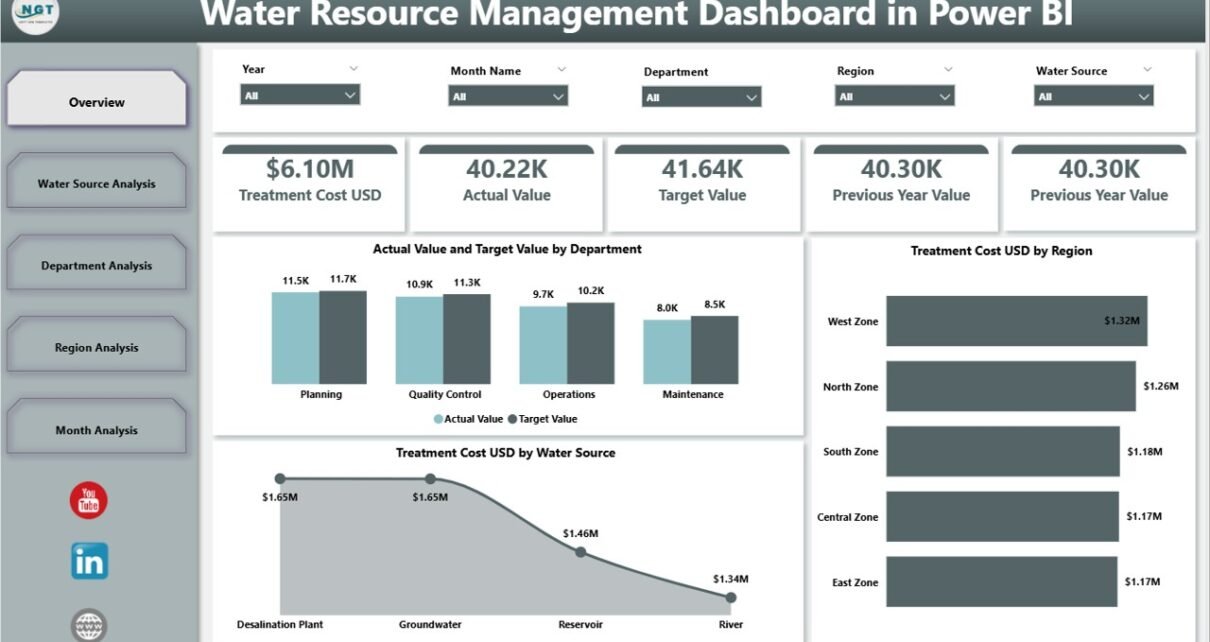
Water Resource Management Dashboard in Power BI

February 9, 2026February 9, 2026 PKComments Off on Water Resource Management Dashboard in Power BI
Water is life. However, managing water resources has become more complex than ever. Cities grow fast. Industries consume more water. Climate change affects rainfall patterns. Therefore, water authorities must track
Read More
Dashboard Power BI

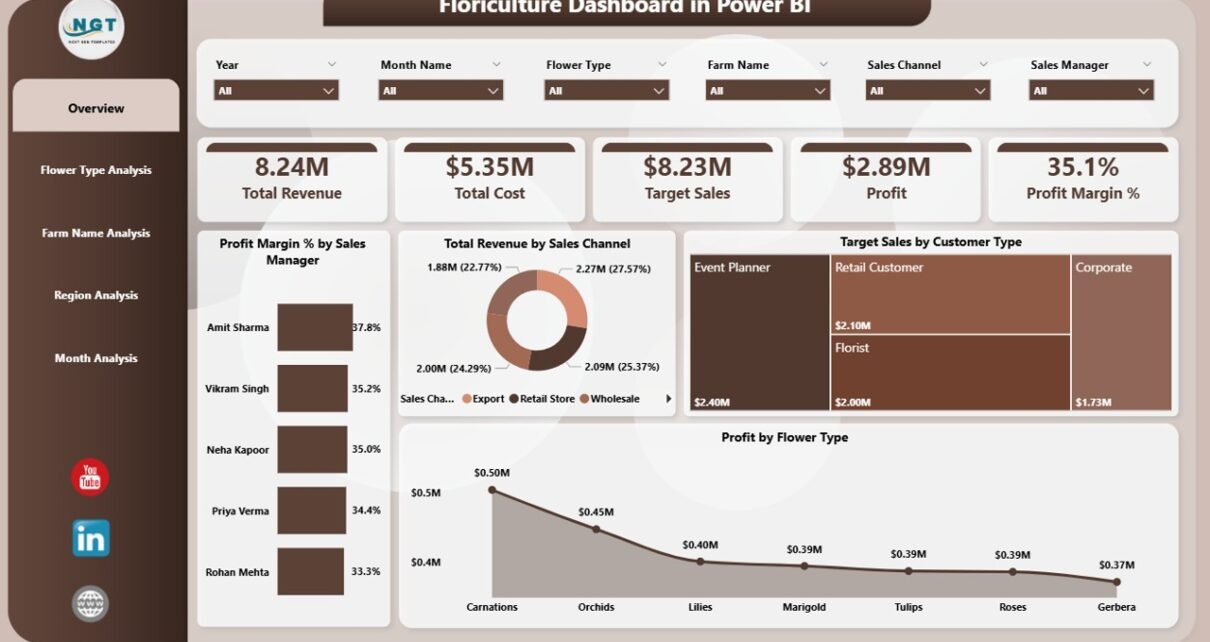
Floriculture Dashboard in Power BI

February 8, 2026February 8, 2026 PKComments Off on Floriculture Dashboard in Power BI
The floriculture industry grows fast. Demand changes with seasons. Festivals increase sales suddenly. Weddings boost premium flower demand. Export orders fluctuate every month. Therefore, floriculture businesses must track revenue, cost,
Read More
Dashboard Power BI

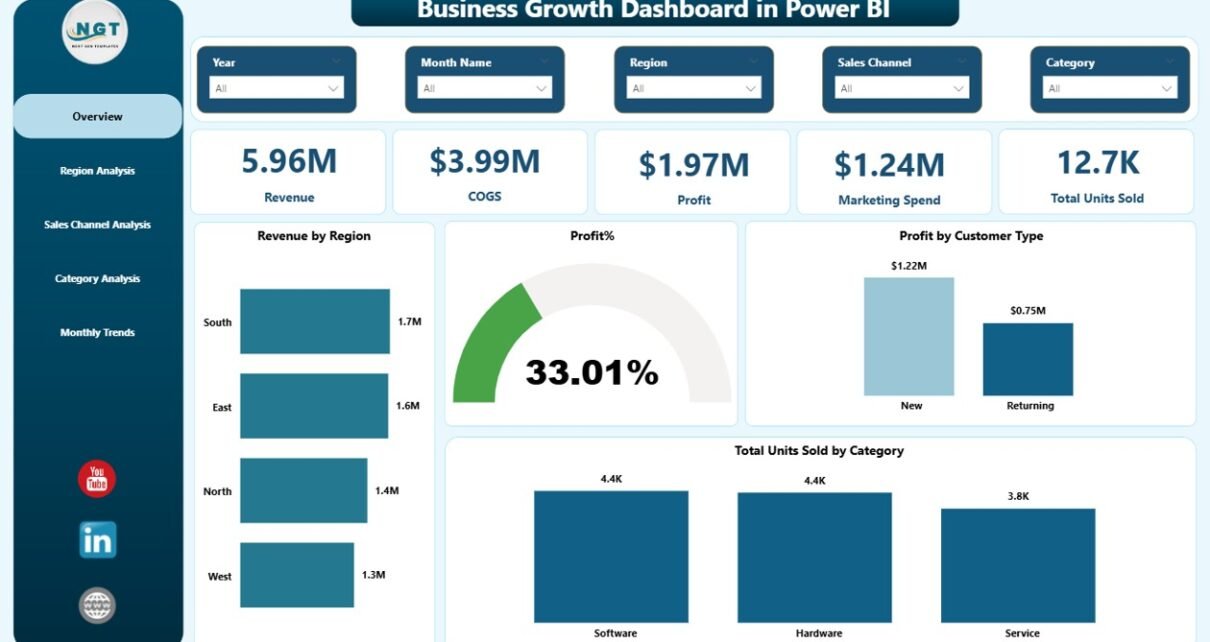
Business Growth Dashboard in Power BI

February 8, 2026February 8, 2026 PKComments Off on Business Growth Dashboard in Power BI
In today’s competitive market, businesses must move fast. Markets change quickly. Customer preferences shift constantly. Costs rise unexpectedly. Therefore, companies must track performance in real time. However, many organizations still
Read More
Dashboard Power BI

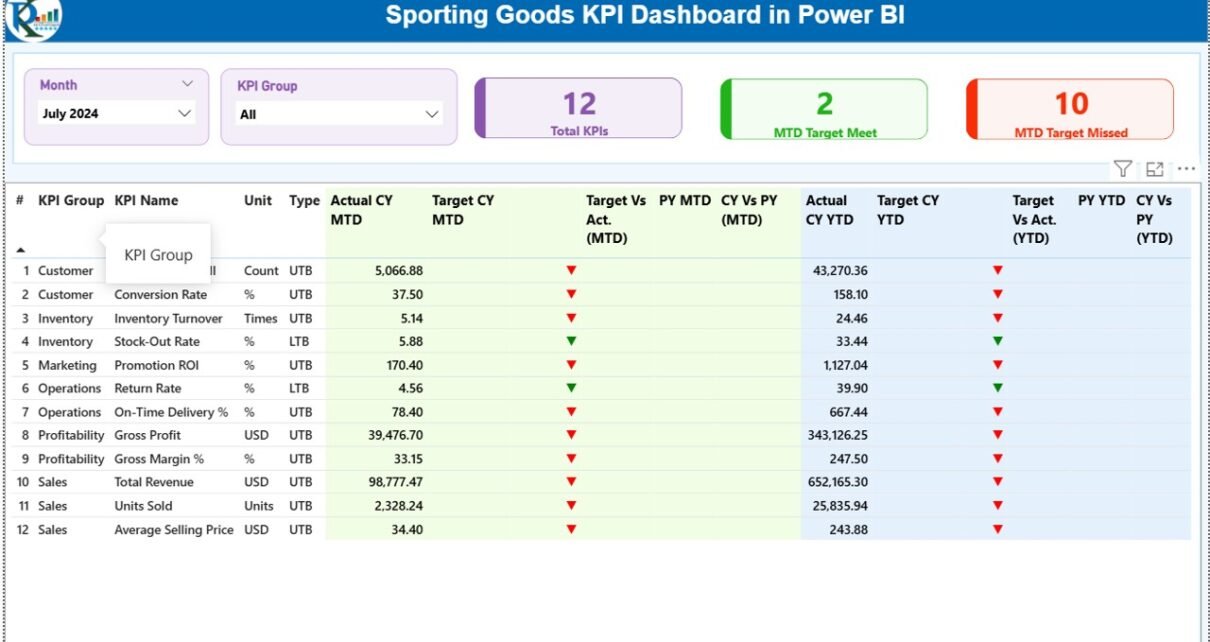
Sporting Goods KPI Dashboard in Power BI

February 8, 2026February 8, 2026 PKComments Off on Sporting Goods KPI Dashboard in Power BI
The sporting goods industry moves fast. Sales change by season. Demand rises during tournaments. Inventory levels shift every month. Therefore, managers must track performance daily. However, many companies still depend
Read More
Dashboard Power BI

Vendor Payment Dashboard in Power BI

February 6, 2026February 6, 2026 PKComments Off on Vendor Payment Dashboard in Power BI
Managing vendor payments plays a critical role in every organization. However, many finance teams still depend on spreadsheets, emails, and manual tracking systems. As a result, they struggle with delayed
Read More
Dashboard Power BI

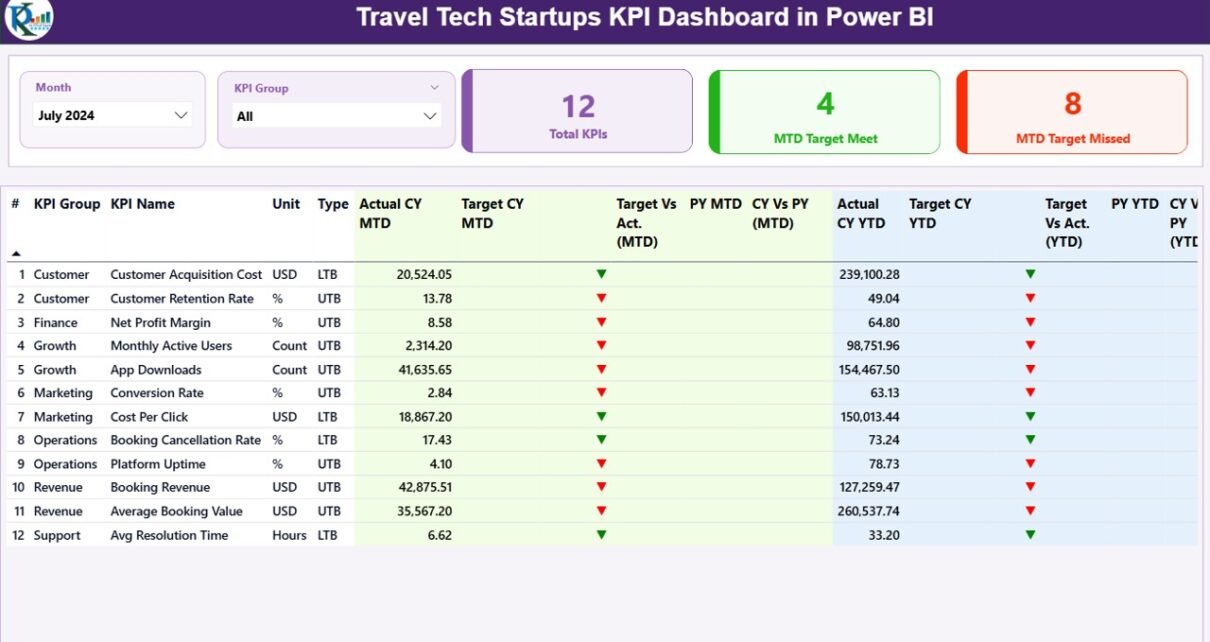
Travel Tech Startups KPI Dashboard in Power BI

February 5, 2026October 10, 2026 PKComments Off on Travel Tech Startups KPI Dashboard in Power BI
Travel tech startups operate in a fast-moving and highly competitive market. Customer behavior changes quickly, demand fluctuates by season, and operational costs remain high. Therefore, founders and leadership teams must
Read More

Posts pagination

Previous 1 … 22 23 24 … 83 Next
  • Learn Excel (Free Course)
    • 1. Shortcut Keys
    • 2. Fill & Flash Fill
    • 3. Find & Replace
    • 4. Sort & Filter
    • 5. Formulas & Functions
    • 6. Data Validation
    • 7. Conditional Formatting
    • 8. Basic Charts
    • 9. Advanced Charts
    • 10. Pivot Tables
    • 11. Excel Dashboards
    • 12. VBA Course
    • 13. Excel Formulas with AI
  • Templates
  • Tutorials
    • Charts and Visualization
    • VBA
    • Excel Tips and Tricks
    • Excel Dashboards
    • Power Pivot & DAX
  • Power BI
  • Template Store
    • Ready to Use Templates
  • Courses
  • Academy
    • Excel + AI Mastery: 100 Formulas
    • Excel Pivot Tables & Dashboards
  • About Us
  • Contact Us
Copyright © 2023 PK-AnExcelExpert.com - Privacy Policy