New: NextGenTemplates Academy - video courses on Excel formulas with AI and Pivot Tables & dashboards. Early-bird: 20% off with code EARLYBIRD20 - first 20 orders only. See the courses →
  • Learn Excel (Free Course)
    • 1. Shortcut Keys
    • 2. Fill & Flash Fill
    • 3. Find & Replace
    • 4. Sort & Filter
    • 5. Formulas & Functions
    • 6. Data Validation
    • 7. Conditional Formatting
    • 8. Basic Charts
    • 9. Advanced Charts
    • 10. Pivot Tables
    • 11. Excel Dashboards
    • 12. VBA Course
    • 13. Excel Formulas with AI
  • Templates
  • Tutorials
    • Charts and Visualization
    • VBA
    • Excel Tips and Tricks
    • Excel Dashboards
    • Power Pivot & DAX
  • Power BI
  • Template Store
    • Ready to Use Templates
  • Courses
  • Academy
    • Excel + AI Mastery: 100 Formulas
    • Excel Pivot Tables & Dashboards
  • About Us
  • Contact Us

PK: An Excel Expert

Transforming Data into Decisions

Tag: KPI Dashboard

Dashboard Power BI

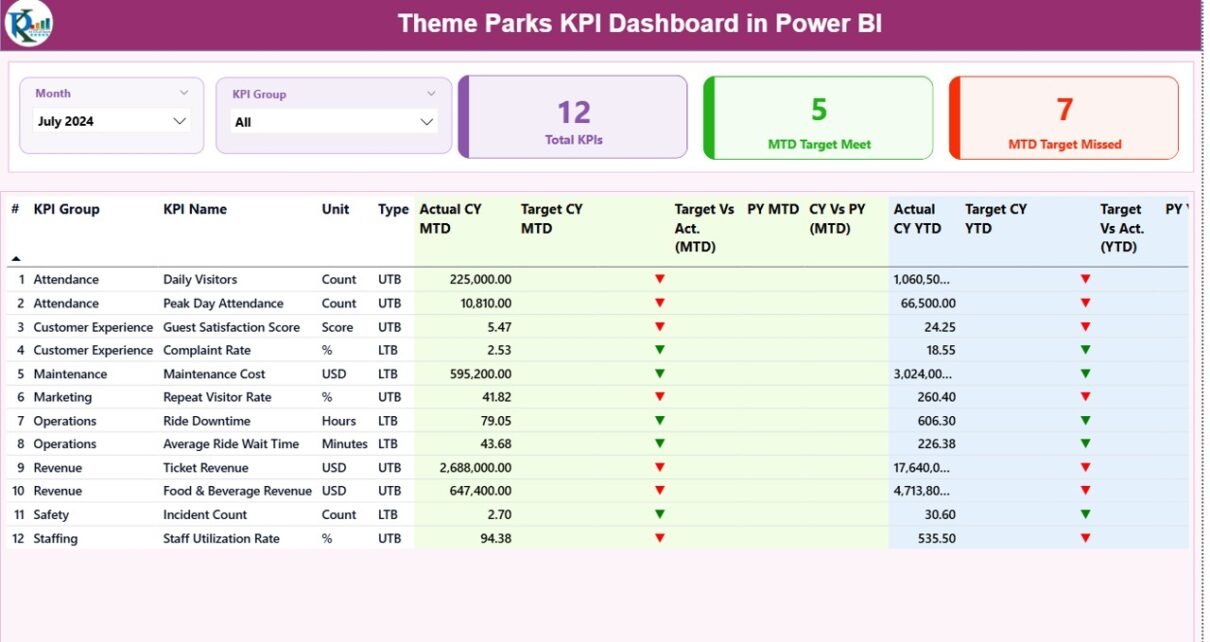
Theme Parks KPI Dashboard in Power BI

January 23, 2026January 23, 2026 PKComments Off on Theme Parks KPI Dashboard in Power BI
Running a theme park is not only about thrilling rides and happy visitors. Instead, it also involves managing operations, tracking performance, controlling costs, and improving guest satisfaction every single day.
Read More
Dashboard

Facility Services Dashboard in Excel

January 22, 2026January 22, 2026 PKComments Off on Facility Services Dashboard in Excel
Managing facility services today is no longer about reacting to issues after they occur. Instead, it is about tracking performance, controlling costs, meeting service-level agreements, and improving customer satisfaction in
Read More
Dashboard Power BI

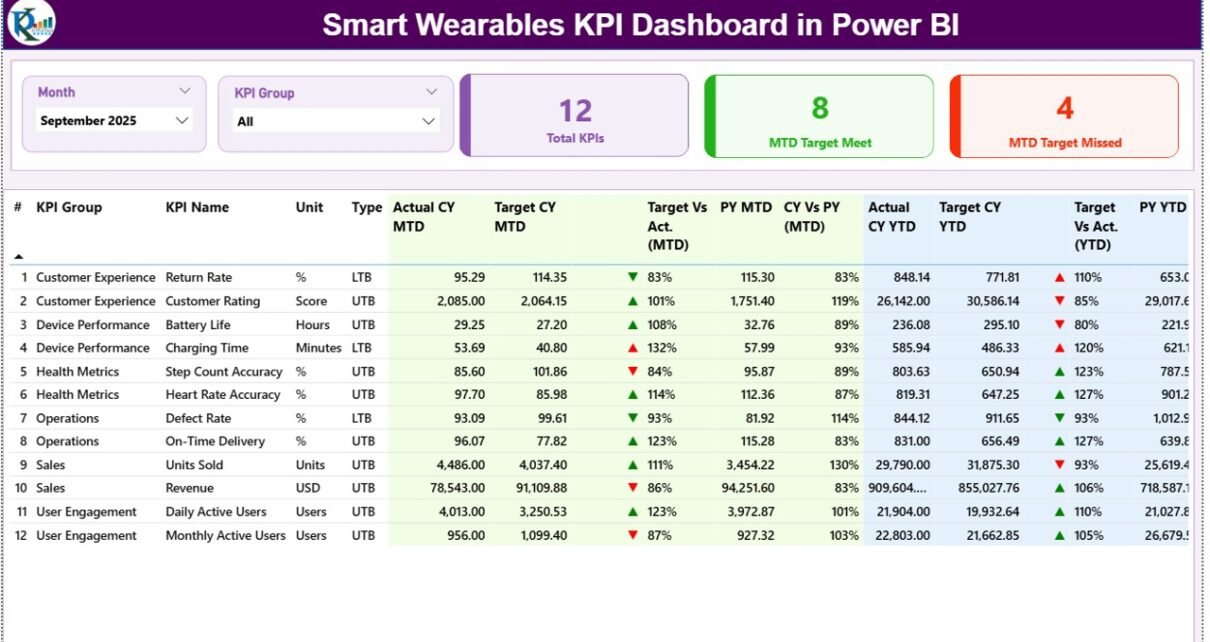
Smart Wearables KPI Dashboard in Power BI

January 22, 2026January 22, 2026 PKComments Off on Smart Wearables KPI Dashboard in Power BI
Smart wearables continue to reshape healthcare, fitness, sports, and lifestyle industries. However, as the market grows rapidly, businesses face one common challenge: tracking performance clearly and accurately. That is exactly
Read More
Dashboard Power BI

Web3 Services KPI Dashboard in Power BI

January 21, 2026January 21, 2026 PKComments Off on Web3 Services KPI Dashboard in Power BI
The Web3 ecosystem grows faster every year. New blockchain platforms, decentralized applications, NFT marketplaces, and crypto-based services enter the market daily. However, growth alone does not guarantee success. Teams must
Read More
Dashboard Power BI

Gaming Esports KPI Dashboard in Power BI

January 21, 2026January 21, 2026 PKComments Off on Gaming Esports KPI Dashboard in Power BI
The esports and gaming industry grows faster than ever before. Every tournament, match, stream, and campaign generates massive data. However, raw data alone never creates success. Teams, managers, analysts, and
Read More
Dashboard Power BI

Autonomous Vehicles KPI Dashboard in Power BI

January 20, 2026January 20, 2026 PKComments Off on Autonomous Vehicles KPI Dashboard in Power BI
Autonomous vehicles are no longer a futuristic idea. Instead, they already operate on roads, in testing zones, and within logistics networks. However, autonomy without measurement leads to uncertainty. Therefore, organizations
Read More
Dashboard

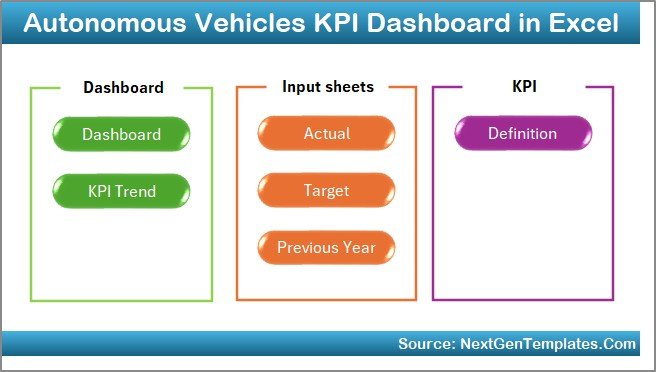
Autonomous Vehicles KPI Dashboard in Excel

January 20, 2026January 20, 2026 PKComments Off on Autonomous Vehicles KPI Dashboard in Excel
The autonomous vehicle industry evolves at a rapid pace. Every day, companies test new algorithms, deploy sensors, analyze driving data, and improve safety systems. However, despite advanced technology, many teams
Read More
Dashboard

Health Insurance Dashboard in Excel

January 19, 2026January 19, 2026 PKComments Off on Health Insurance Dashboard in Excel
Managing health insurance data without clear visibility creates confusion, delays, and financial risks. Every health insurance organization deals with large volumes of data related to premiums, claims, policy types, regions,
Read More
Dashboard

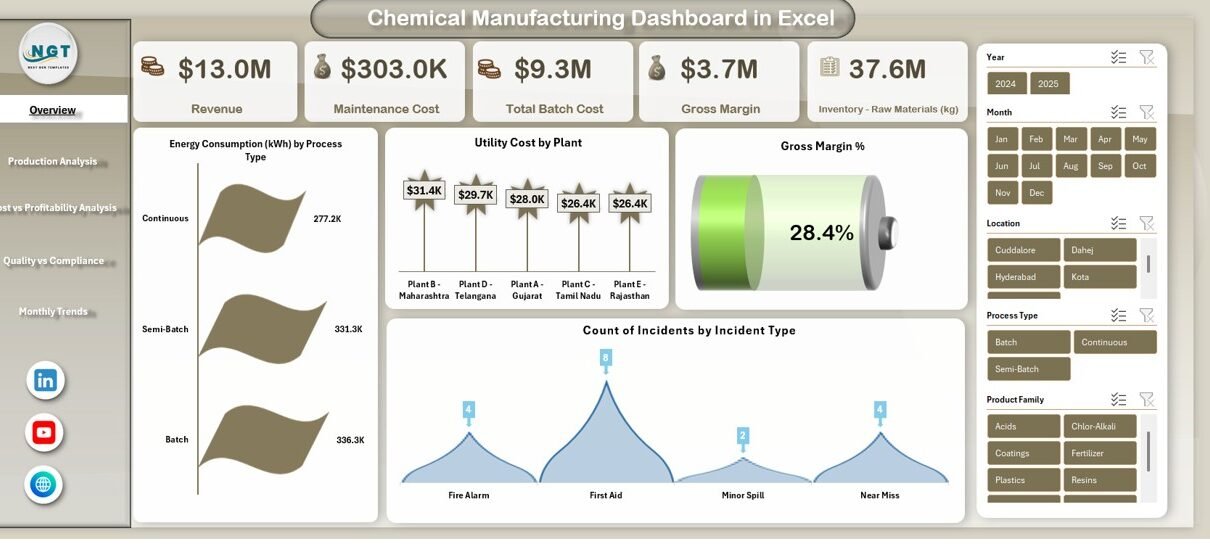
Chemical Manufacturing Dashboard in Excel

January 18, 2026January 18, 2026 PKComments Off on Chemical Manufacturing Dashboard in Excel
In today’s highly regulated and cost-sensitive chemical industry, data-driven decision-making is no longer optional. Chemical manufacturers deal with massive volumes of operational, financial, environmental, and quality data every single day.
Read More
Dashboard Power BI

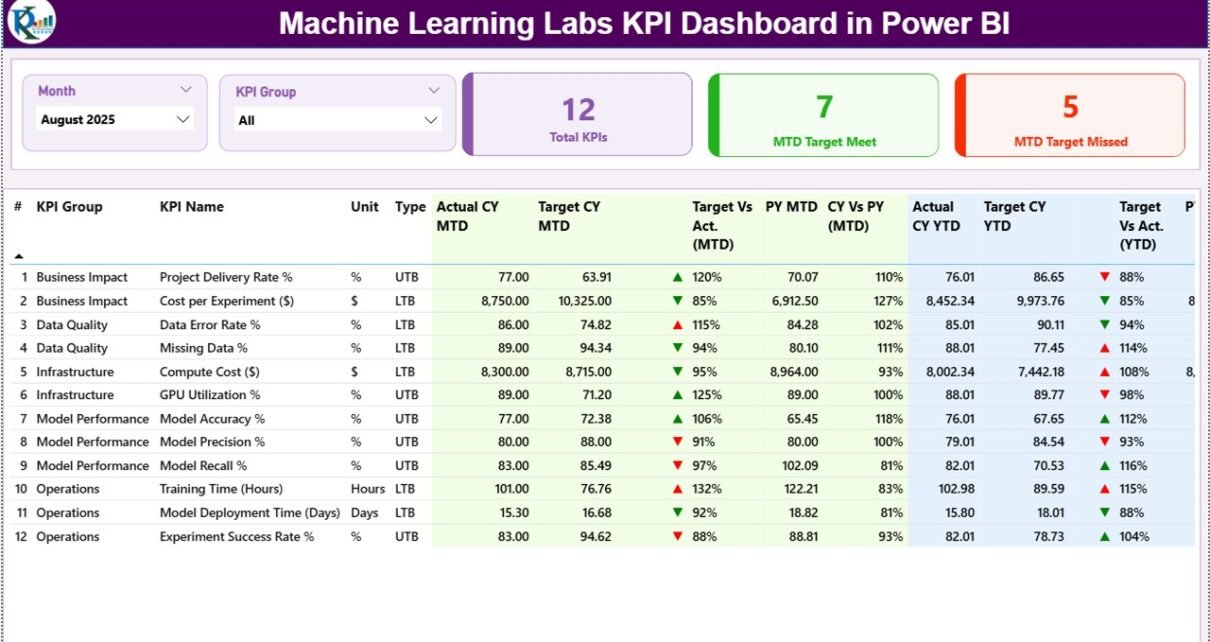
Machine Learning Labs KPI Dashboard in Power BI

January 18, 2026January 18, 2026 PKComments Off on Machine Learning Labs KPI Dashboard in Power BI
Running a machine learning lab requires constant tracking of experiments, models, data quality, costs, timelines, and outcomes. However, when teams store this information in scattered Excel files or disconnected tools,
Read More

Posts pagination

Previous 1 … 24 25 26 … 83 Next
  • Learn Excel (Free Course)
    • 1. Shortcut Keys
    • 2. Fill & Flash Fill
    • 3. Find & Replace
    • 4. Sort & Filter
    • 5. Formulas & Functions
    • 6. Data Validation
    • 7. Conditional Formatting
    • 8. Basic Charts
    • 9. Advanced Charts
    • 10. Pivot Tables
    • 11. Excel Dashboards
    • 12. VBA Course
    • 13. Excel Formulas with AI
  • Templates
  • Tutorials
    • Charts and Visualization
    • VBA
    • Excel Tips and Tricks
    • Excel Dashboards
    • Power Pivot & DAX
  • Power BI
  • Template Store
    • Ready to Use Templates
  • Courses
  • Academy
    • Excel + AI Mastery: 100 Formulas
    • Excel Pivot Tables & Dashboards
  • About Us
  • Contact Us
Copyright © 2023 PK-AnExcelExpert.com - Privacy Policy