New: NextGenTemplates Academy - video courses on Excel formulas with AI and Pivot Tables & dashboards. Early-bird: 20% off with code EARLYBIRD20 - first 20 orders only. See the courses →
  • Learn Excel (Free Course)
    • 1. Shortcut Keys
    • 2. Fill & Flash Fill
    • 3. Find & Replace
    • 4. Sort & Filter
    • 5. Formulas & Functions
    • 6. Data Validation
    • 7. Conditional Formatting
    • 8. Basic Charts
    • 9. Advanced Charts
    • 10. Pivot Tables
    • 11. Excel Dashboards
    • 12. VBA Course
    • 13. Excel Formulas with AI
  • Templates
  • Tutorials
    • Charts and Visualization
    • VBA
    • Excel Tips and Tricks
    • Excel Dashboards
    • Power Pivot & DAX
  • Power BI
  • Template Store
    • Ready to Use Templates
  • Courses
  • Academy
    • Excel + AI Mastery: 100 Formulas
    • Excel Pivot Tables & Dashboards
  • About Us
  • Contact Us

PK: An Excel Expert

Transforming Data into Decisions

Tag: KPI Dashboard

Power BI

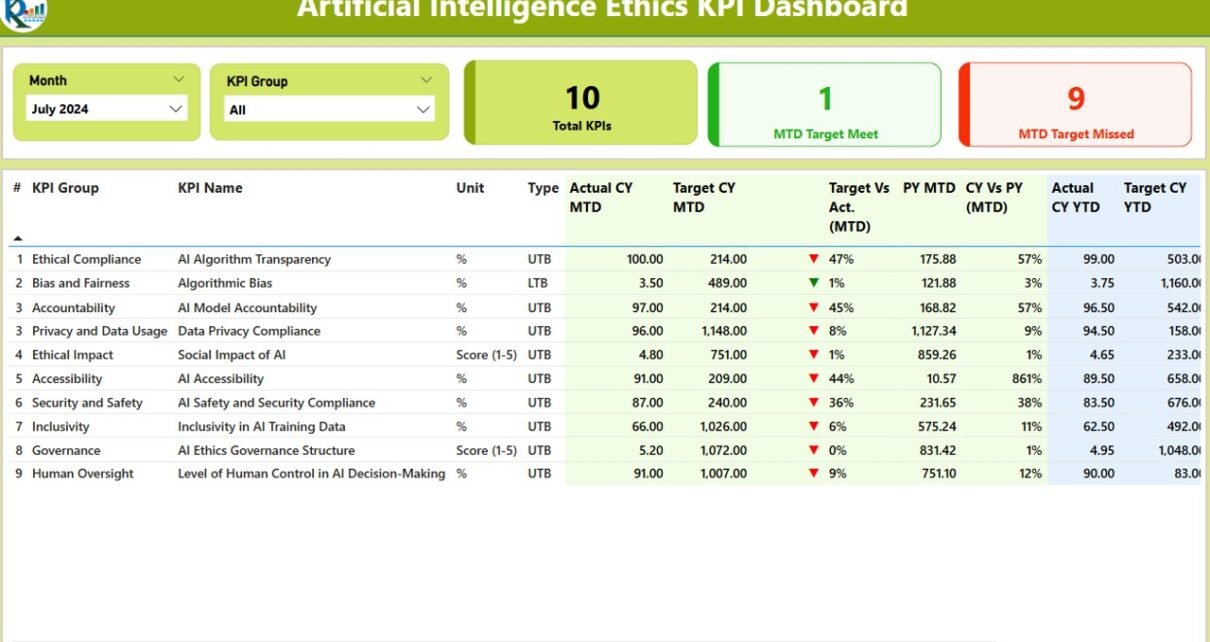
Artificial Intelligence Ethics KPI Dashboard in Power BI

March 11, 2025March 13, 2025 PKComments Off on Artificial Intelligence Ethics KPI Dashboard in Power BI
Artificial Intelligence (AI) has become a transformative force across industries, revolutionizing the way businesses and governments function. With the increasing reliance on AI, ensuring ethical standards and transparency in AI
Read More
Dashboard

Mobile App Engagement KPI Dashboard in Excel

March 11, 2025March 11, 2025 PKComments Off on Mobile App Engagement KPI Dashboard in Excel
In today's competitive digital landscape, tracking mobile app engagement is crucial for understanding user behavior, improving retention, and optimizing marketing efforts. A well-structured Mobile App Engagement KPI Dashboard in Excel
Read More
Dashboard

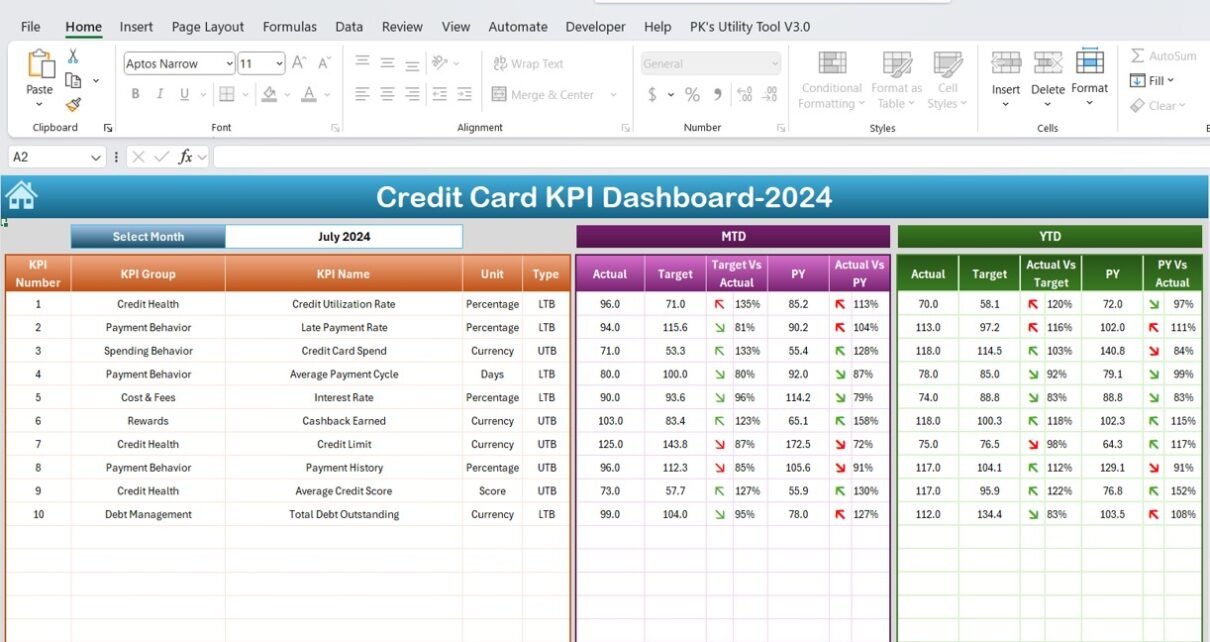
Credit Card KPI Dashboard in Excel

March 11, 2025March 11, 2025 PKComments Off on Credit Card KPI Dashboard in Excel
A Credit Card KPI Dashboard is an essential tool for tracking key performance indicators (KPIs) related to credit card usage, performance, and customer management. With the rise of data-driven decision-making,
Read More
Power BI

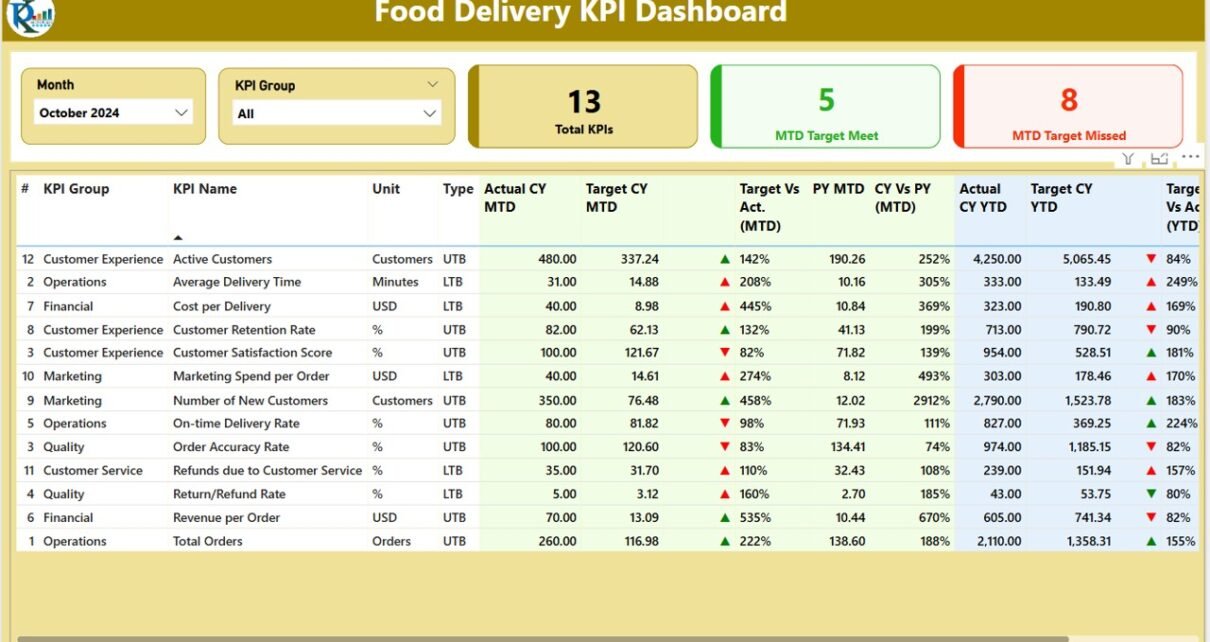
Food Delivery KPI Dashboard in Power BI

March 10, 2025March 10, 2025 PKComments Off on Food Delivery KPI Dashboard in Power BI
In the food delivery industry, tracking performance metrics is vital to ensure smooth operations, enhance customer satisfaction, and improve profitability. Key Performance Indicators (KPIs) serve as the benchmark for success,
Read More
Dashboard

Location-Based Marketing KPI Dashboard in Excel

March 10, 2025March 10, 2025 PKComments Off on Location-Based Marketing KPI Dashboard in Excel
In today's data-driven world, businesses need real-time insights to make strategic decisions. Location-based marketing (LBM) is an essential strategy for businesses looking to optimize their marketing efforts by targeting specific
Read More
Dashboard

Banking Operations KPI Dashboard in Excel

March 10, 2025March 10, 2025 PKComments Off on Banking Operations KPI Dashboard in Excel
The financial world thrives on data, and for banking operations, the key to success is not just analyzing raw figures but tracking them with precision. One of the best ways
Read More
Power BI

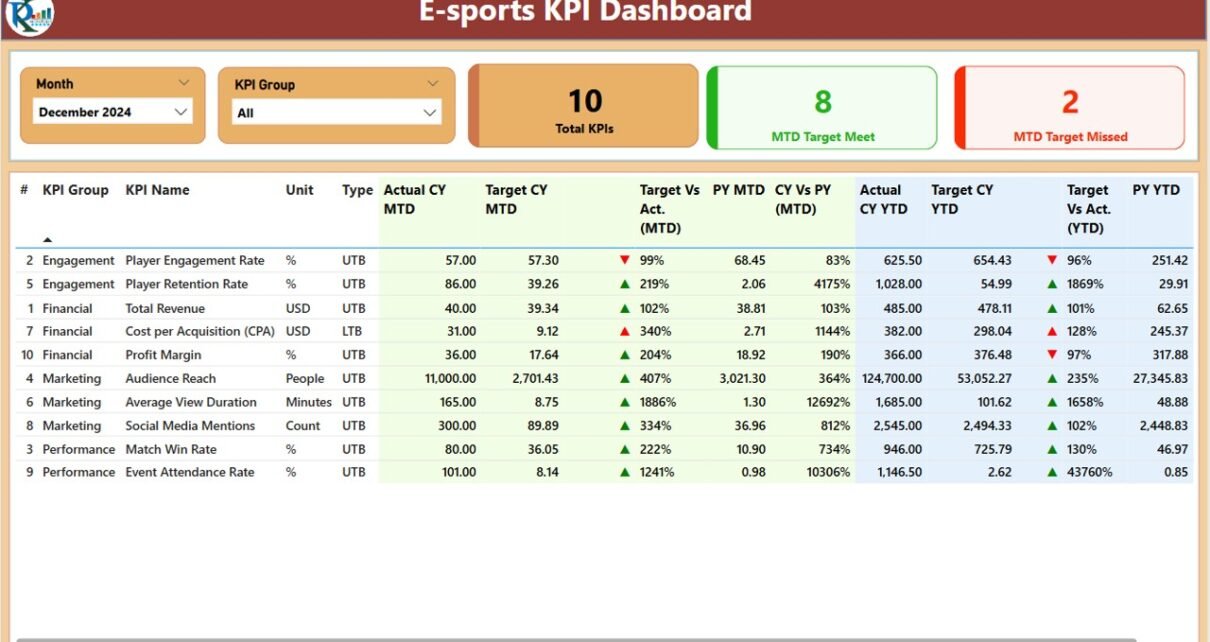
E-sports KPI Dashboard in Power BI

March 9, 2025March 9, 2025 PKComments Off on E-sports KPI Dashboard in Power BI
The E-sports industry has grown exponentially in the last decade, with millions of fans and players around the globe. However, the rapid expansion of E-sports has led to a new
Read More
Dashboard

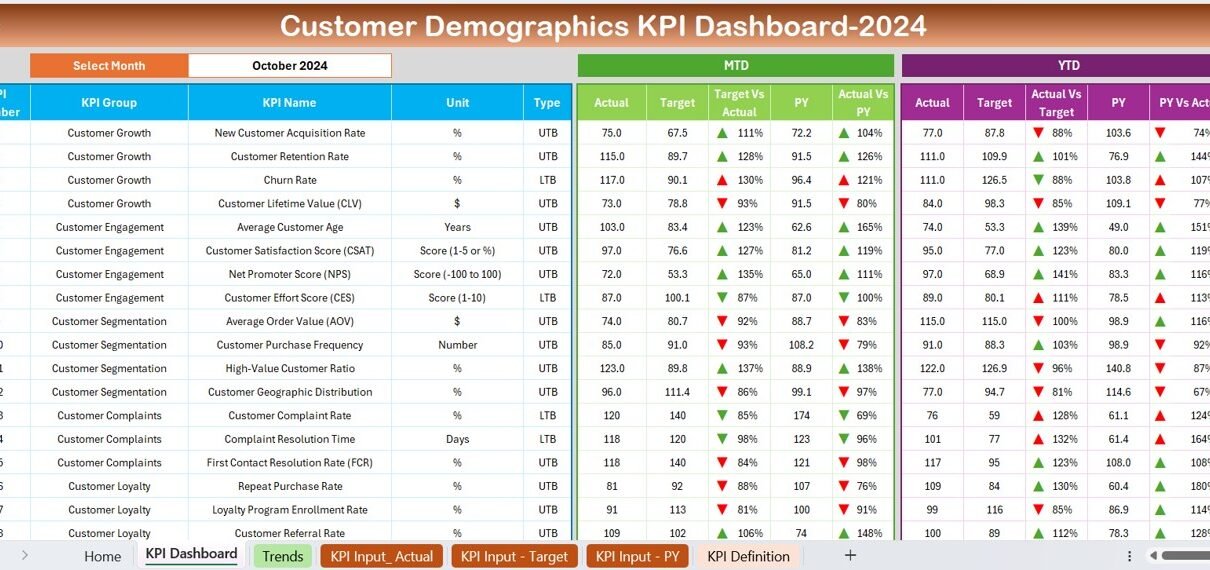
Customer Demographics KPI Dashboard in Excel

March 9, 2025March 9, 2025 PKComments Off on Customer Demographics KPI Dashboard in Excel
In today's data-driven world, businesses need a clear understanding of their customer demographics to make informed marketing and operational decisions. A Customer Demographics KPI Dashboard in Excel simplifies the process
Read More
Dashboard

Personal Investment KPI Dashboard in Excel

March 9, 2025March 9, 2025 PKComments Off on Personal Investment KPI Dashboard in Excel
In the fast-paced world of personal finance, tracking and managing your investments can feel overwhelming. But what if there was a way to simplify this process, allowing you to easily
Read More
Dashboard

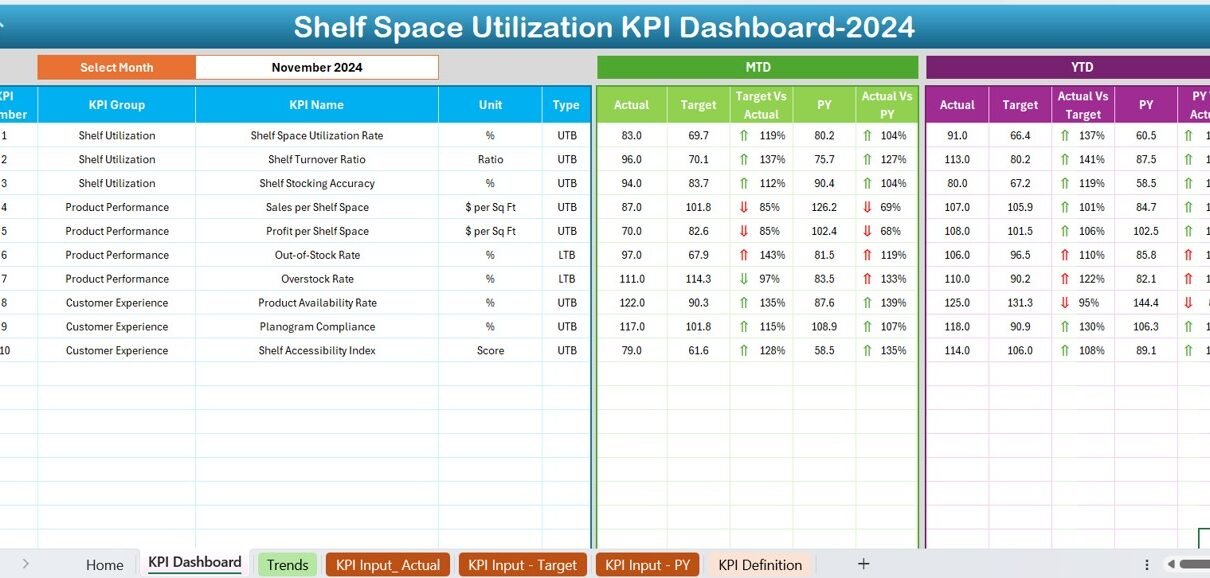
Shelf Space Utilization KPI Dashboard in Excel

March 6, 2025March 6, 2025 PKComments Off on Shelf Space Utilization KPI Dashboard in Excel
In the competitive retail industry, efficient shelf space utilization is crucial for maximizing sales and improving customer experience. To help businesses monitor and optimize their shelf space usage, we have
Read More

Posts pagination

Previous 1 … 52 53 54 … 83 Next
  • Learn Excel (Free Course)
    • 1. Shortcut Keys
    • 2. Fill & Flash Fill
    • 3. Find & Replace
    • 4. Sort & Filter
    • 5. Formulas & Functions
    • 6. Data Validation
    • 7. Conditional Formatting
    • 8. Basic Charts
    • 9. Advanced Charts
    • 10. Pivot Tables
    • 11. Excel Dashboards
    • 12. VBA Course
    • 13. Excel Formulas with AI
  • Templates
  • Tutorials
    • Charts and Visualization
    • VBA
    • Excel Tips and Tricks
    • Excel Dashboards
    • Power Pivot & DAX
  • Power BI
  • Template Store
    • Ready to Use Templates
  • Courses
  • Academy
    • Excel + AI Mastery: 100 Formulas
    • Excel Pivot Tables & Dashboards
  • About Us
  • Contact Us
Copyright © 2023 PK-AnExcelExpert.com - Privacy Policy