New: NextGenTemplates Academy - video courses on Excel formulas with AI and Pivot Tables & dashboards. Early-bird: 20% off with code EARLYBIRD20 - first 20 orders only. See the courses →
  • Learn Excel (Free Course)
    • 1. Shortcut Keys
    • 2. Fill & Flash Fill
    • 3. Find & Replace
    • 4. Sort & Filter
    • 5. Formulas & Functions
    • 6. Data Validation
    • 7. Conditional Formatting
    • 8. Basic Charts
    • 9. Advanced Charts
    • 10. Pivot Tables
    • 11. Excel Dashboards
    • 12. VBA Course
    • 13. Excel Formulas with AI
  • Templates
  • Tutorials
    • Charts and Visualization
    • VBA
    • Excel Tips and Tricks
    • Excel Dashboards
    • Power Pivot & DAX
  • Power BI
  • Template Store
    • Ready to Use Templates
  • Courses
  • Academy
    • Excel + AI Mastery: 100 Formulas
    • Excel Pivot Tables & Dashboards
  • About Us
  • Contact Us

PK: An Excel Expert

Transforming Data into Decisions

Tag: KPI definition sheet

Dashboard

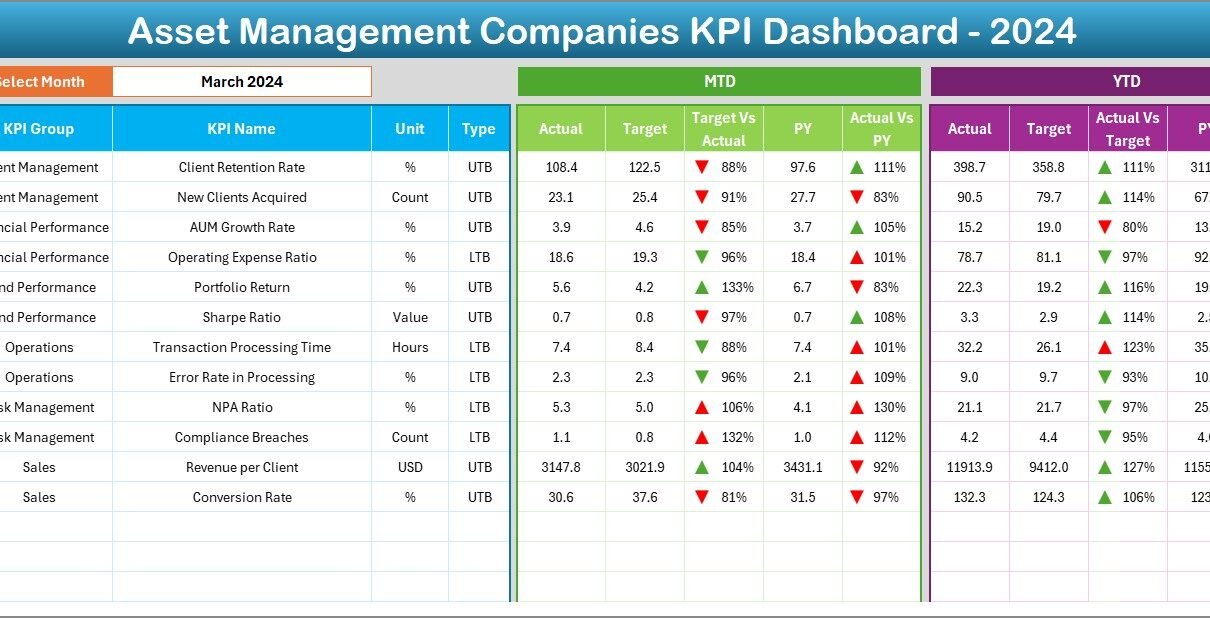
Asset Management Companies KPI Dashboard in Excel

December 5, 2025December 5, 2025 PKComments Off on Asset Management Companies KPI Dashboard in Excel
Asset management companies handle large portfolios, investment strategies, client relationships, compliance tasks, and performance monitoring every day. Because these firms work with sensitive financial data and strict reporting deadlines, decision-makers
Read More
Dashboard

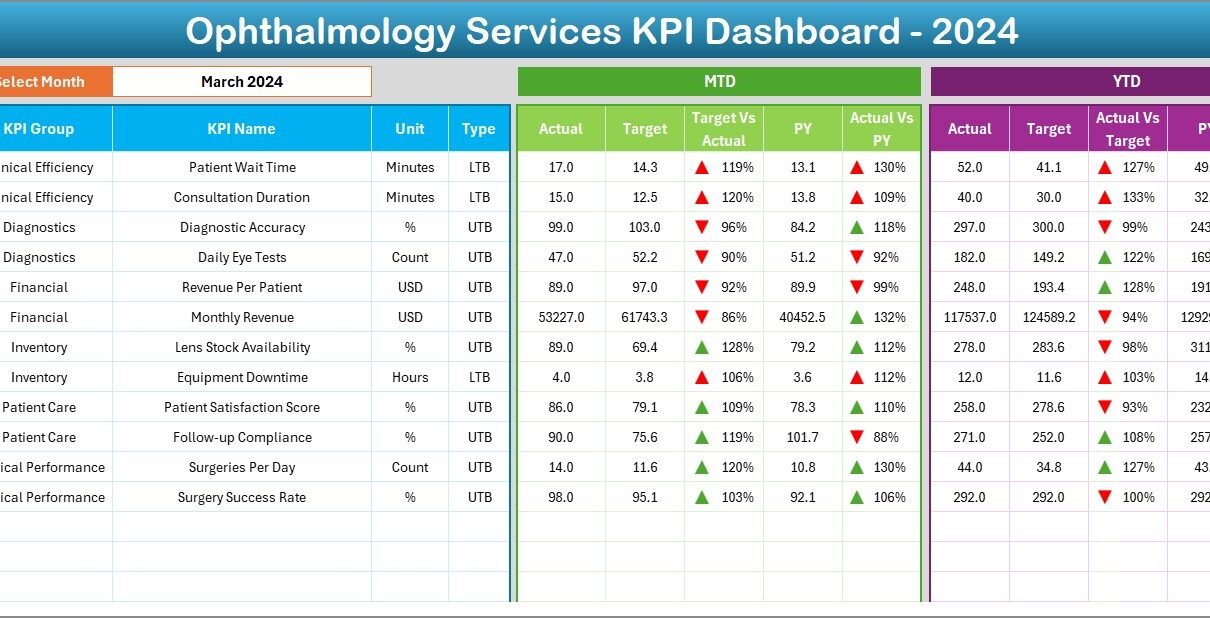
Ophthalmology Services KPI Dashboard in Excel

November 23, 2025November 23, 2025 PKComments Off on Ophthalmology Services KPI Dashboard in Excel
Ophthalmology is one of the fastest-growing specialties in healthcare. As patient demand rises and diagnostic technologies evolve, eye-care providers need accurate, real-time insights to track performance, improve services, and maintain
Read More
Templates

Public Sector KPI Scorecard in Excel

October 12, 2025October 12, 2025 PKComments Off on Public Sector KPI Scorecard in Excel
In today’s data-driven world, public sector organizations face increasing pressure to demonstrate accountability, efficiency, and performance transparency. To meet these demands, leaders must rely on accurate and easy-to-interpret performance metrics.
Read More
Dashboard

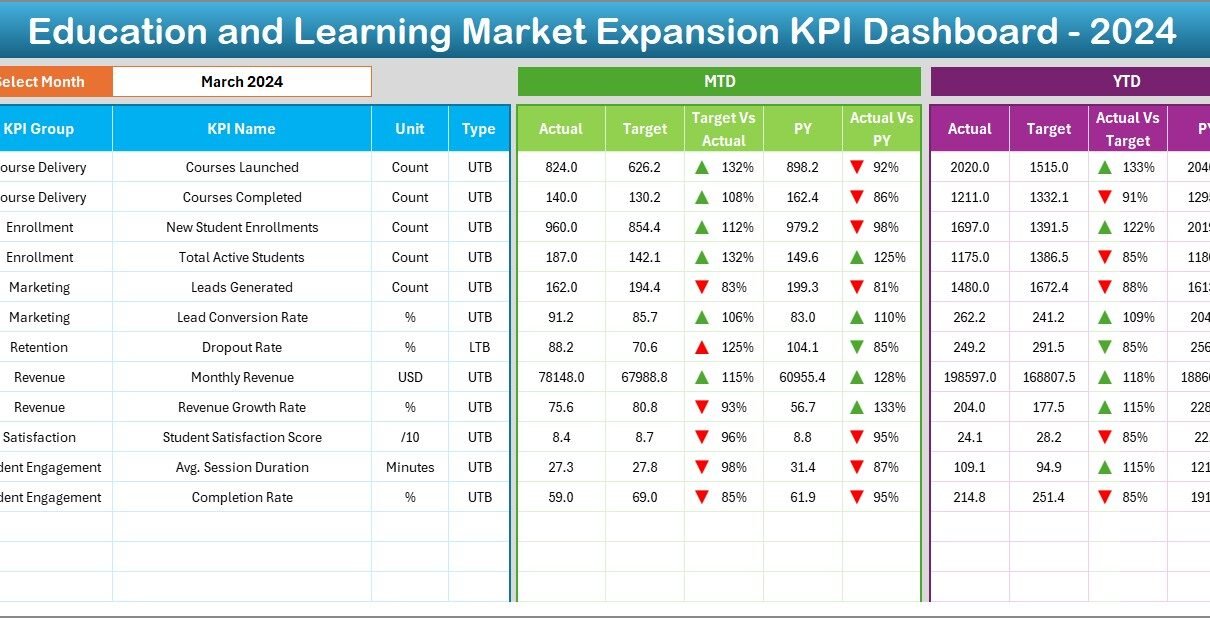
Education and Learning Market Expansion KPI Dashboard in Excel

June 7, 2025June 7, 2025 PKComments Off on Education and Learning Market Expansion KPI Dashboard in Excel
In the evolving world of education, institutions and training organizations must track performance, growth, and expansion metrics effectively. One powerful way to do this is through a KPI Dashboard built
Read More
  • Learn Excel (Free Course)
    • 1. Shortcut Keys
    • 2. Fill & Flash Fill
    • 3. Find & Replace
    • 4. Sort & Filter
    • 5. Formulas & Functions
    • 6. Data Validation
    • 7. Conditional Formatting
    • 8. Basic Charts
    • 9. Advanced Charts
    • 10. Pivot Tables
    • 11. Excel Dashboards
    • 12. VBA Course
    • 13. Excel Formulas with AI
  • Templates
  • Tutorials
    • Charts and Visualization
    • VBA
    • Excel Tips and Tricks
    • Excel Dashboards
    • Power Pivot & DAX
  • Power BI
  • Template Store
    • Ready to Use Templates
  • Courses
  • Academy
    • Excel + AI Mastery: 100 Formulas
    • Excel Pivot Tables & Dashboards
  • About Us
  • Contact Us
Copyright © 2023 PK-AnExcelExpert.com - Privacy Policy