New: NextGenTemplates Academy - video courses on Excel formulas with AI and Pivot Tables & dashboards. Early-bird: 20% off with code EARLYBIRD20 - first 20 orders only. See the courses →
  • Learn Excel (Free Course)
    • 1. Shortcut Keys
    • 2. Fill & Flash Fill
    • 3. Find & Replace
    • 4. Sort & Filter
    • 5. Formulas & Functions
    • 6. Data Validation
    • 7. Conditional Formatting
    • 8. Basic Charts
    • 9. Advanced Charts
    • 10. Pivot Tables
    • 11. Excel Dashboards
    • 12. VBA Course
    • 13. Excel Formulas with AI
  • Templates
  • Tutorials
    • Charts and Visualization
    • VBA
    • Excel Tips and Tricks
    • Excel Dashboards
    • Power Pivot & DAX
  • Power BI
  • Template Store
    • Ready to Use Templates
  • Courses
  • Academy
    • Excel + AI Mastery: 100 Formulas
    • Excel Pivot Tables & Dashboards
  • About Us
  • Contact Us

PK: An Excel Expert

Transforming Data into Decisions

Tag: KPI performance

Dashboard Power BI

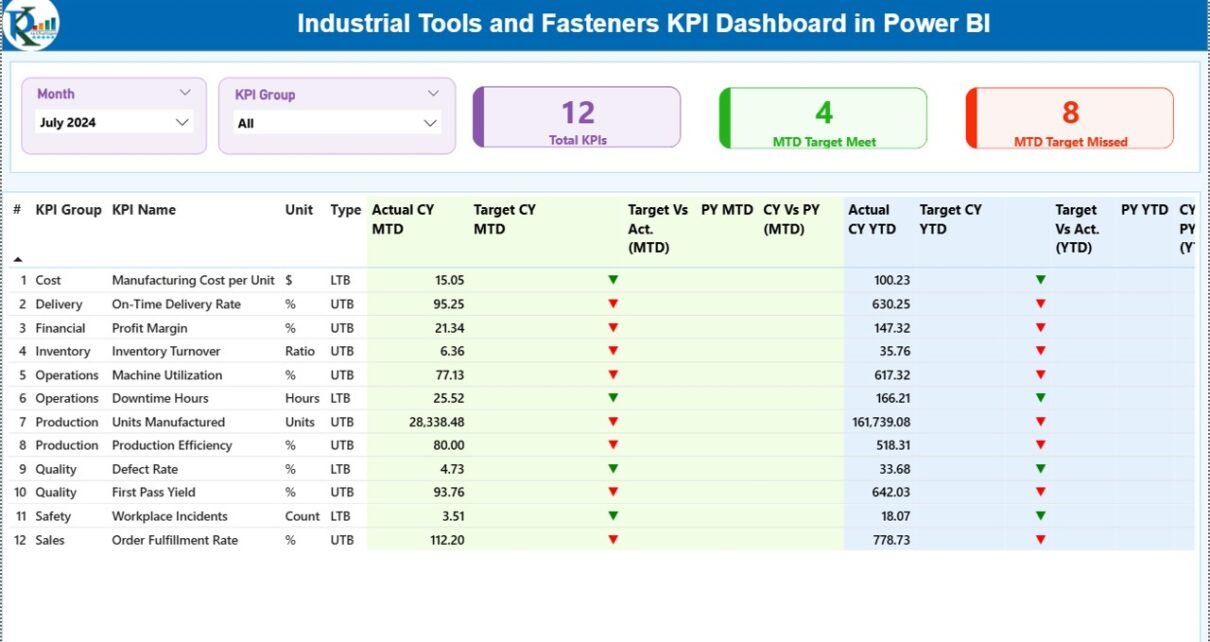
Industrial Tools and Fasteners KPI Dashboard in Power BI

February 28, 2026February 28, 2026 PKComments Off on Industrial Tools and Fasteners KPI Dashboard in Power BI
In today’s competitive manufacturing environment, industrial tools and fasteners companies must monitor performance continuously to maintain quality, control costs, and improve operational efficiency. However, many organizations still depend on scattered
Read More
Dashboard Power BI

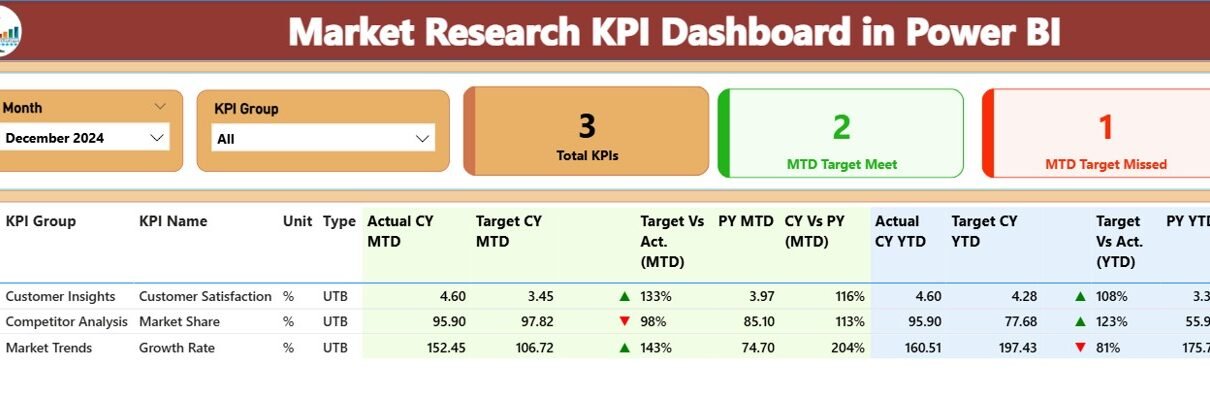
Market Research KPI Dashboard in Power BI

July 13, 2025July 13, 2025 PKComments Off on Market Research KPI Dashboard in Power BI
In today’s data-driven world, staying on top of key performance indicators (KPIs) is crucial for understanding market trends and making informed decisions. The Market Research KPI Dashboard in Power BI
Read More
Power BI

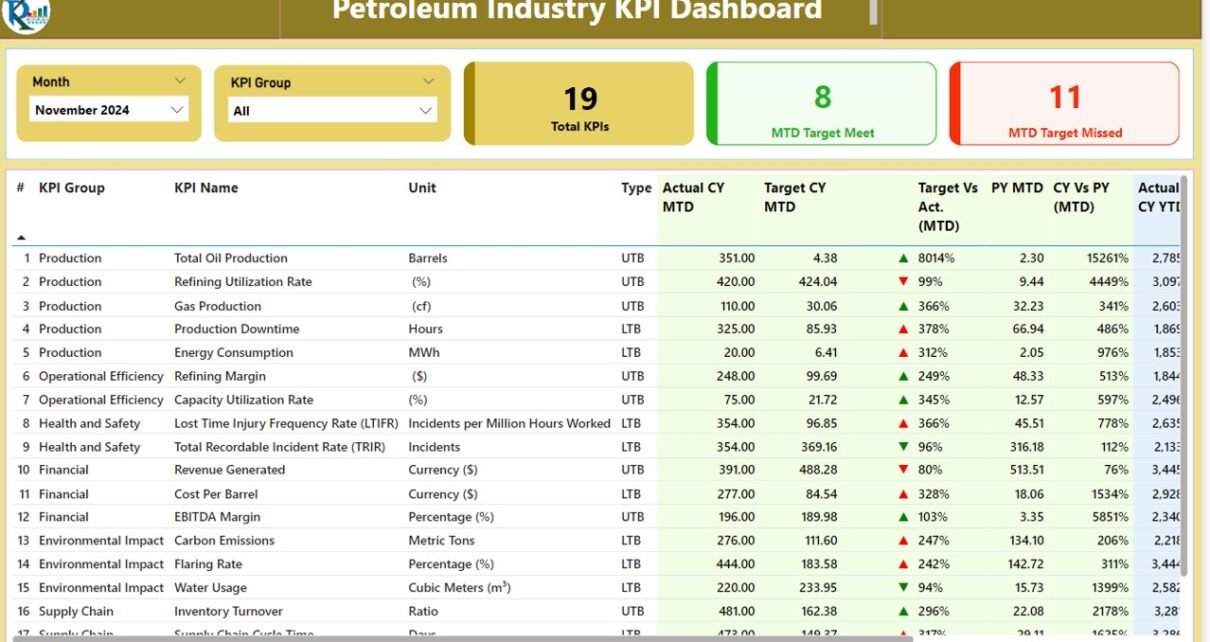
Petroleum Industry KPI Dashboard in Power BI

January 24, 2025March 19, 2025 PKComments Off on Petroleum Industry KPI Dashboard in Power BI
The petroleum industry is a complex and fast-paced sector that requires precise monitoring of key performance indicators (KPIs) to optimize operations, reduce costs, and ensure safety. The Petroleum Industry KPI
Read More
Manufacturing KPI Dashboard
Dashboard

Manufacturing KPI Dashboard

October 7, 2024February 20, 2025 PKComments Off on Manufacturing KPI Dashboard
In today's competitive manufacturing industry, tracking and managing Key Performance Indicators (KPIs) is crucial for maintaining efficiency, reducing costs, and improving overall output. A Manufacturing KPI Dashboard provides an easy-to-use,
Read More
  • Learn Excel (Free Course)
    • 1. Shortcut Keys
    • 2. Fill & Flash Fill
    • 3. Find & Replace
    • 4. Sort & Filter
    • 5. Formulas & Functions
    • 6. Data Validation
    • 7. Conditional Formatting
    • 8. Basic Charts
    • 9. Advanced Charts
    • 10. Pivot Tables
    • 11. Excel Dashboards
    • 12. VBA Course
    • 13. Excel Formulas with AI
  • Templates
  • Tutorials
    • Charts and Visualization
    • VBA
    • Excel Tips and Tricks
    • Excel Dashboards
    • Power Pivot & DAX
  • Power BI
  • Template Store
    • Ready to Use Templates
  • Courses
  • Academy
    • Excel + AI Mastery: 100 Formulas
    • Excel Pivot Tables & Dashboards
  • About Us
  • Contact Us
Copyright © 2023 PK-AnExcelExpert.com - Privacy Policy