New: NextGenTemplates Academy - video courses on Excel formulas with AI and Pivot Tables & dashboards. Early-bird: 20% off with code EARLYBIRD20 - first 20 orders only. See the courses →
  • Learn Excel (Free Course)
    • 1. Shortcut Keys
    • 2. Fill & Flash Fill
    • 3. Find & Replace
    • 4. Sort & Filter
    • 5. Formulas & Functions
    • 6. Data Validation
    • 7. Conditional Formatting
    • 8. Basic Charts
    • 9. Advanced Charts
    • 10. Pivot Tables
    • 11. Excel Dashboards
    • 12. VBA Course
    • 13. Excel Formulas with AI
  • Templates
  • Tutorials
    • Charts and Visualization
    • VBA
    • Excel Tips and Tricks
    • Excel Dashboards
    • Power Pivot & DAX
  • Power BI
  • Template Store
    • Ready to Use Templates
  • Courses
  • Academy
    • Excel + AI Mastery: 100 Formulas
    • Excel Pivot Tables & Dashboards
  • About Us
  • Contact Us

PK: An Excel Expert

Transforming Data into Decisions

Tag: KPI trend analysis

Dashboard Power BI

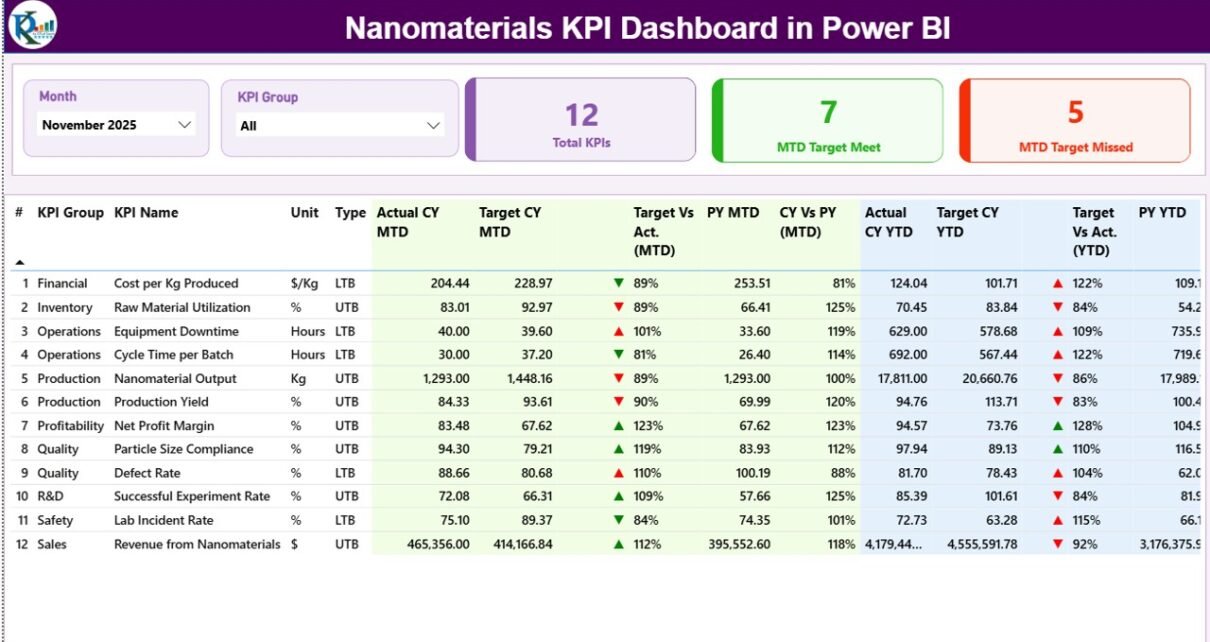
Nanomaterials KPI Dashboard in Power BI

February 26, 2026February 26, 2026 PKComments Off on Nanomaterials KPI Dashboard in Power BI
Modern nanotechnology organizations operate in a highly data-driven environment. Companies involved in nanomaterials research, manufacturing, and commercialization must continuously monitor performance indicators such as production efficiency, material quality, research output,
Read More
Dashboard

Nanomaterials KPI Dashboard in Excel

February 26, 2026February 26, 2026 PKComments Off on Nanomaterials KPI Dashboard in Excel
Nanotechnology continues to transform modern industries. Today, companies use nanomaterials in electronics, healthcare, energy storage, coatings, aerospace, and advanced manufacturing. However, as nanomaterial production grows, organizations must measure performance accurately
Read More
Templates

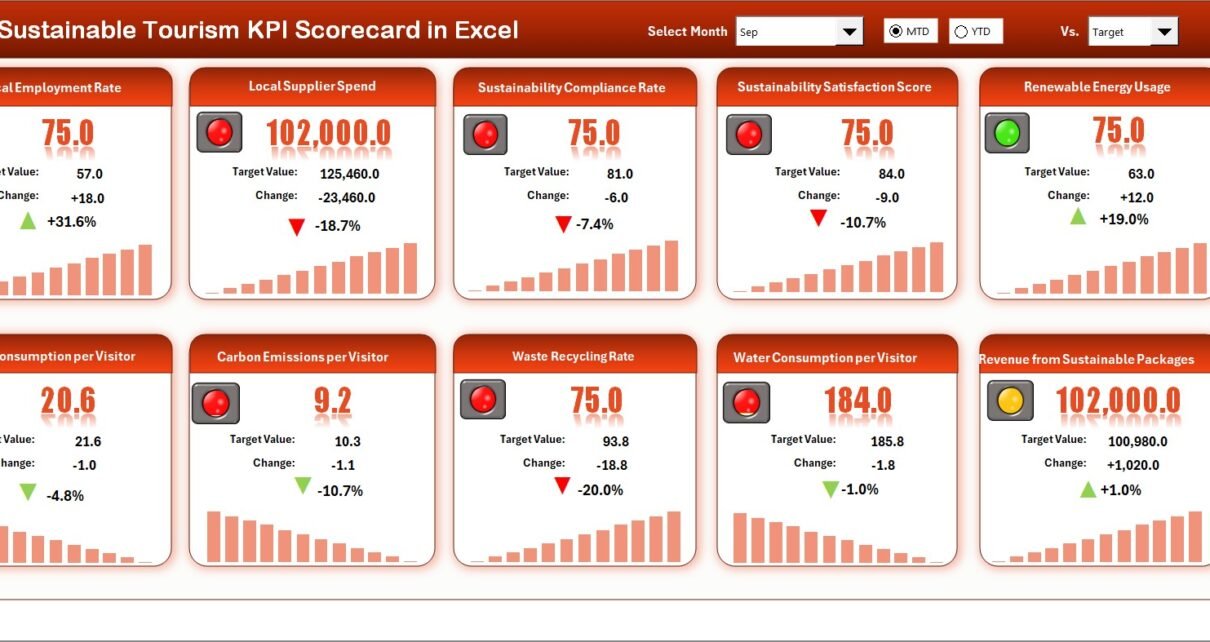
Sustainable Tourism KPI Scorecard In Excel

February 23, 2026February 23, 2026 PKComments Off on Sustainable Tourism KPI Scorecard In Excel
Sustainable tourism keeps growing because travelers now care about nature, culture, and local communities. At the same time, tourism businesses must protect resources while still earning revenue. Therefore, you need
Read More
Dashboard Power BI

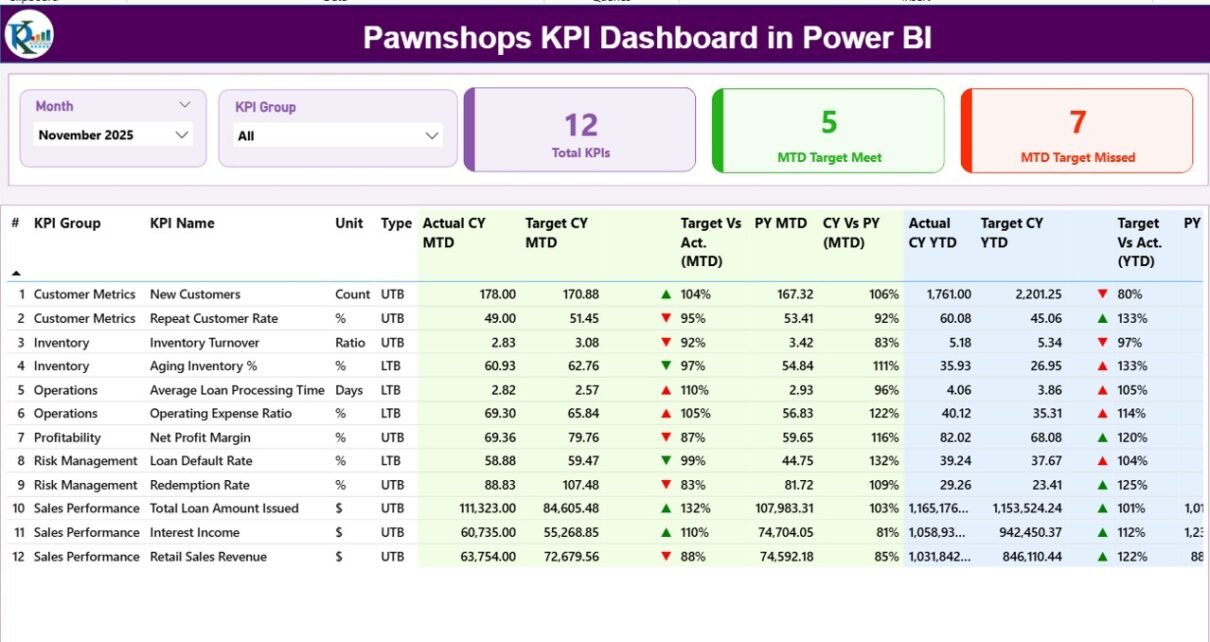
Pawnshops KPI Dashboard in Power BI

February 18, 2026February 18, 2026 PKComments Off on Pawnshops KPI Dashboard in Power BI
In today’s competitive retail and financial service market, pawnshops must track performance carefully. Many pawnshop owners manage daily transactions, gold loans, resale items, and customer relationships. However, without a structured
Read More
Templates

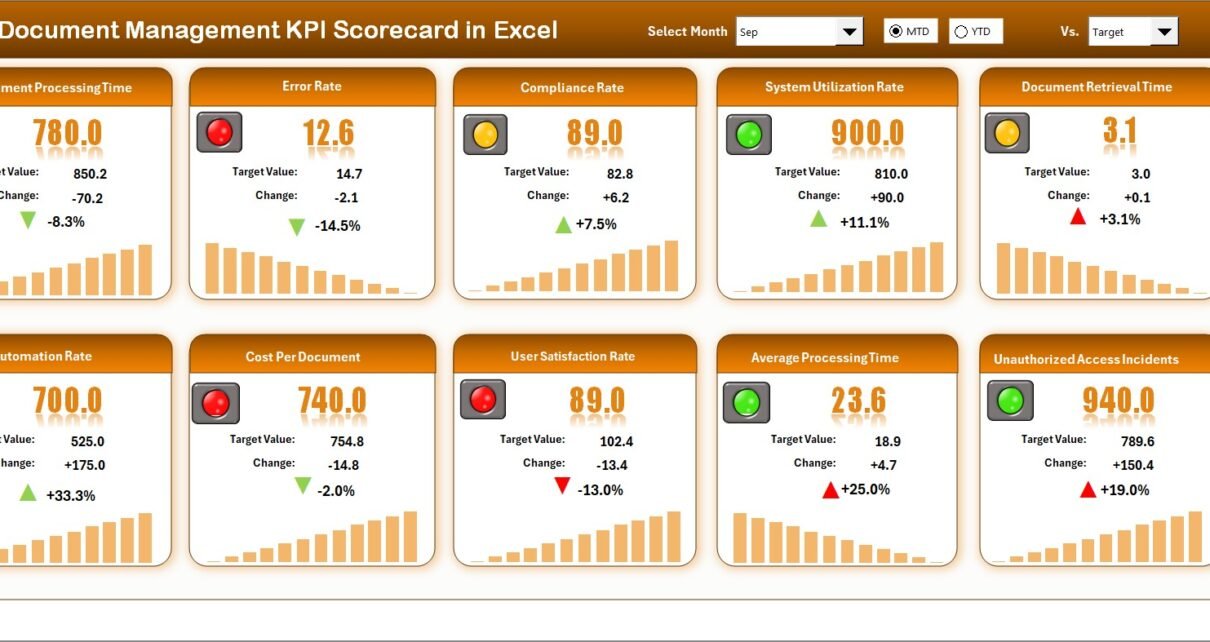
Document Management KPI Scorecard In Excel

February 17, 2026February 17, 2026 PKComments Off on Document Management KPI Scorecard In Excel
Managing documents sounds simple. However, in reality, it becomes complex very quickly. Teams create files daily. Departments share reports. Compliance rules demand accuracy. Meanwhile, managers expect fast access and zero
Read More
Dashboard

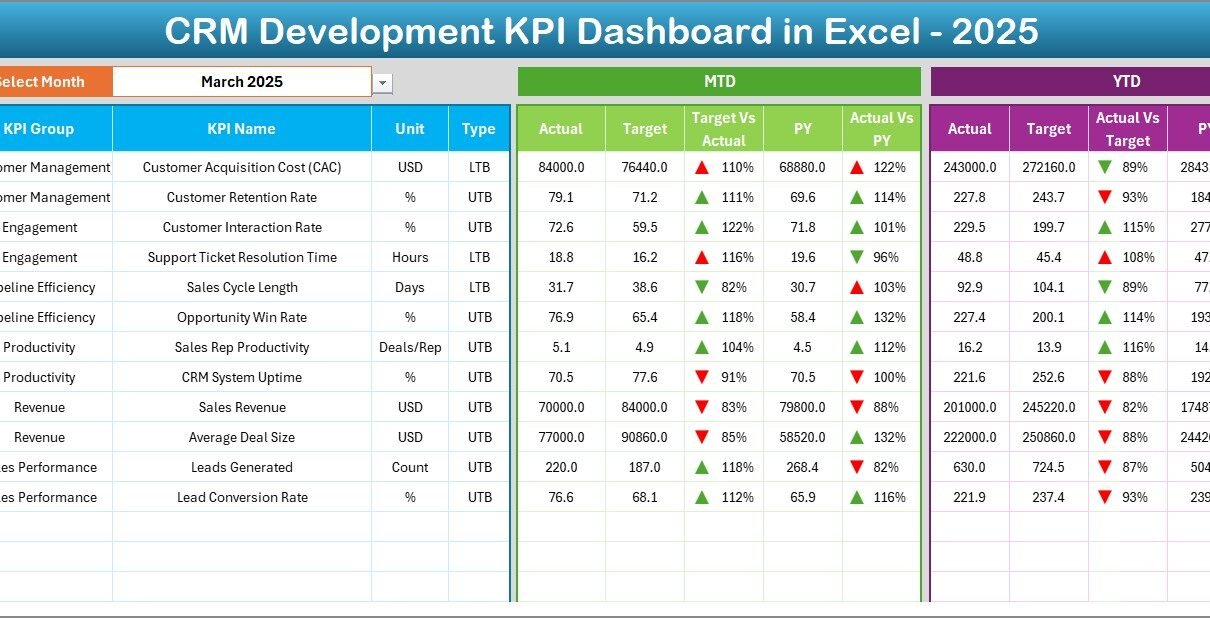
CRM Development KPI Dashboard in Excel

February 17, 2026February 17, 2026 PKComments Off on CRM Development KPI Dashboard in Excel
Customer relationships drive modern business growth. However, CRM development teams often struggle to measure performance clearly. They manage multiple metrics, track targets, monitor customer data, and report to management. Still,
Read More
Dashboard Power BI

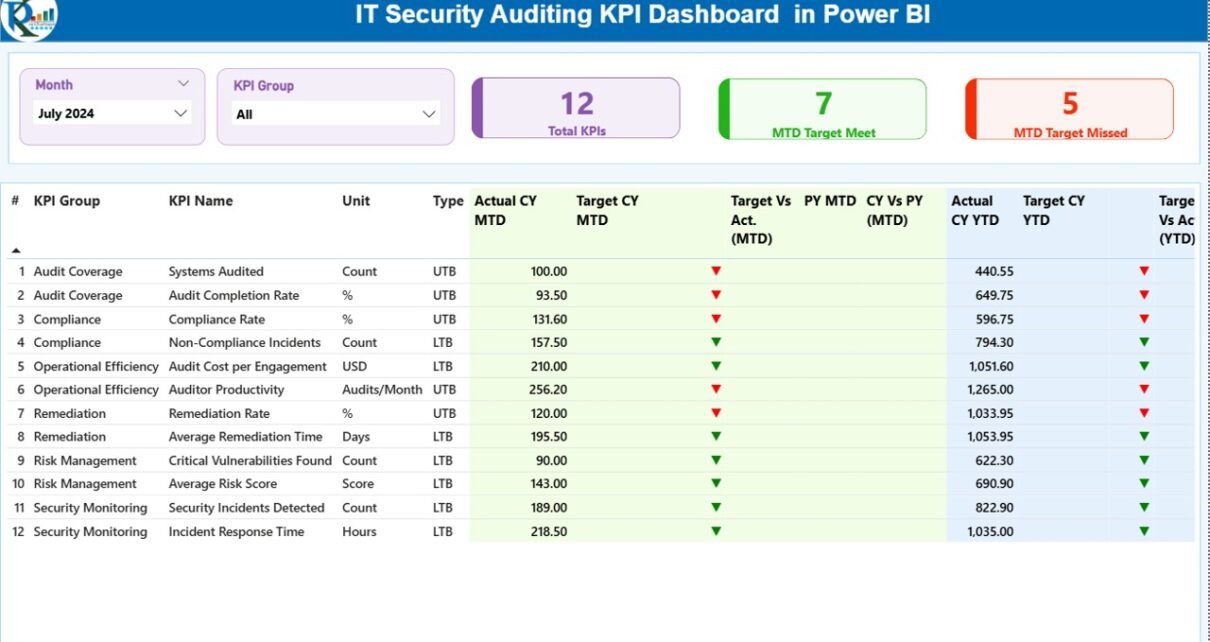
IT Security Auditing KPI Dashboard in Power BI

February 15, 2026February 15, 2026 PKComments Off on IT Security Auditing KPI Dashboard in Power BI
In today’s digital world, cyber threats grow every single day. Hackers target systems. Data breaches increase. Compliance rules change frequently. Therefore, organizations must track security performance continuously. However, many IT
Read More
Templates

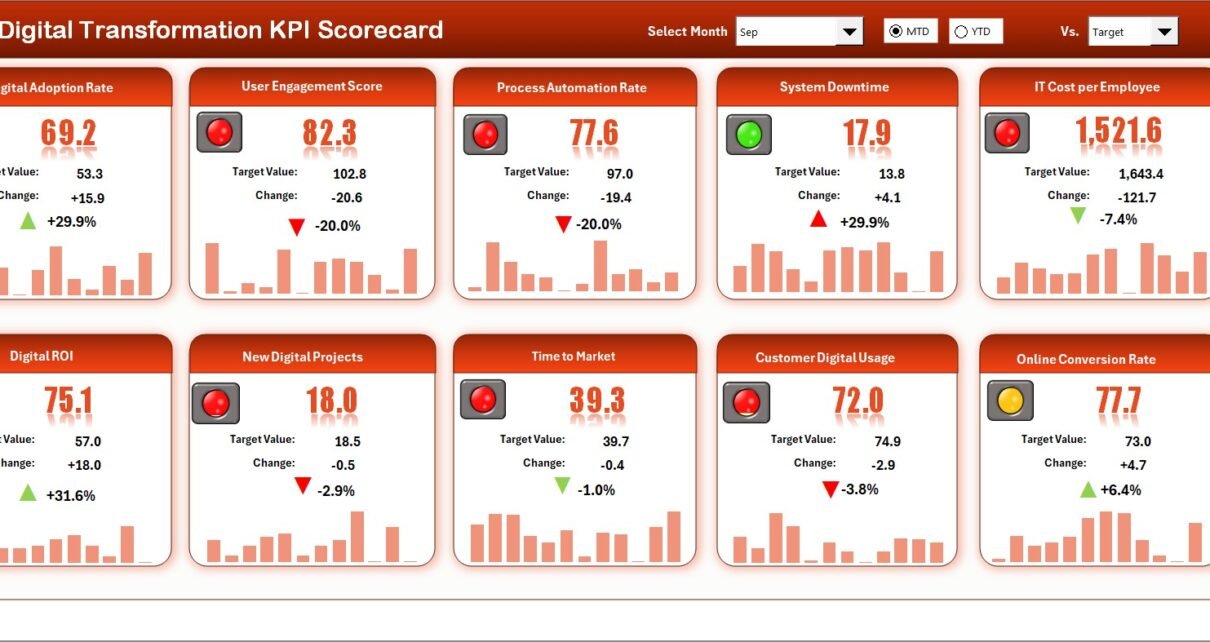
Digital Transformation KPI Scorecard in Excel

February 14, 2026February 14, 2026 PKComments Off on Digital Transformation KPI Scorecard in Excel
In today’s fast-moving business world, companies invest heavily in digital tools. However, many leaders still struggle to measure whether those investments truly deliver results. Although organizations launch automation projects, cloud
Read More
Dashboard Power BI

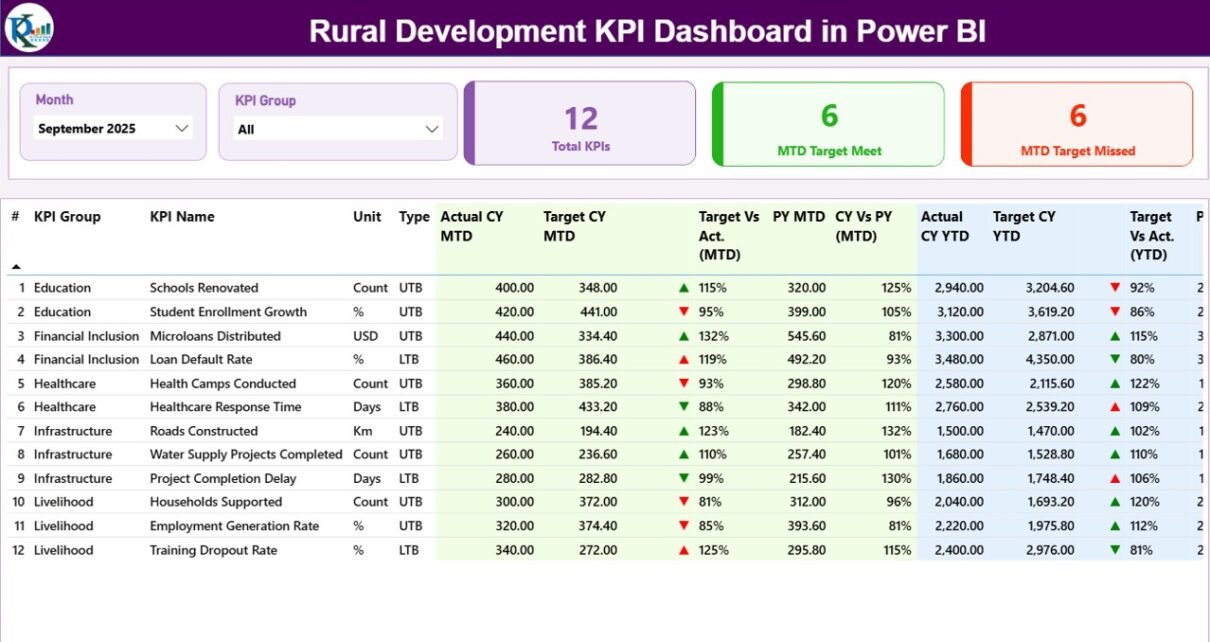
Rural Development KPI Dashboard in Power BI

February 12, 2026February 12, 2026 PKComments Off on Rural Development KPI Dashboard in Power BI
Rural development drives economic stability, social growth, and long-term sustainability. However, many government bodies and NGOs still track rural programs using scattered spreadsheets. As a result, decision-makers struggle to measure
Read More
Dashboard

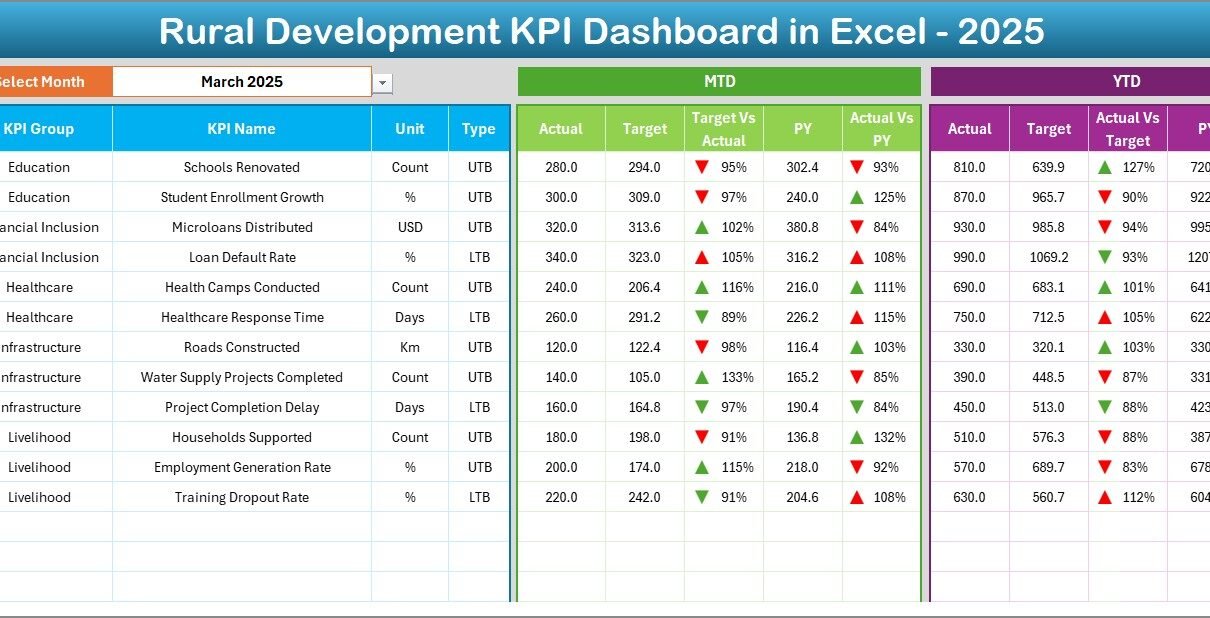
Rural Development KPI Dashboard in Excel

February 12, 2026February 12, 2026 PKComments Off on Rural Development KPI Dashboard in Excel
Rural development drives economic growth, improves livelihoods, and strengthens communities. However, many development teams still track progress in scattered spreadsheets. As a result, leaders struggle to monitor targets, compare yearly
Read More

Posts pagination

1 2 … 4 Next
  • Learn Excel (Free Course)
    • 1. Shortcut Keys
    • 2. Fill & Flash Fill
    • 3. Find & Replace
    • 4. Sort & Filter
    • 5. Formulas & Functions
    • 6. Data Validation
    • 7. Conditional Formatting
    • 8. Basic Charts
    • 9. Advanced Charts
    • 10. Pivot Tables
    • 11. Excel Dashboards
    • 12. VBA Course
    • 13. Excel Formulas with AI
  • Templates
  • Tutorials
    • Charts and Visualization
    • VBA
    • Excel Tips and Tricks
    • Excel Dashboards
    • Power Pivot & DAX
  • Power BI
  • Template Store
    • Ready to Use Templates
  • Courses
  • Academy
    • Excel + AI Mastery: 100 Formulas
    • Excel Pivot Tables & Dashboards
  • About Us
  • Contact Us
Copyright © 2023 PK-AnExcelExpert.com - Privacy Policy