New: NextGenTemplates Academy - video courses on Excel formulas with AI and Pivot Tables & dashboards. Early-bird: 20% off with code EARLYBIRD20 - first 20 orders only. See the courses →
  • Learn Excel (Free Course)
    • 1. Shortcut Keys
    • 2. Fill & Flash Fill
    • 3. Find & Replace
    • 4. Sort & Filter
    • 5. Formulas & Functions
    • 6. Data Validation
    • 7. Conditional Formatting
    • 8. Basic Charts
    • 9. Advanced Charts
    • 10. Pivot Tables
    • 11. Excel Dashboards
    • 12. VBA Course
    • 13. Excel Formulas with AI
  • Templates
  • Tutorials
    • Charts and Visualization
    • VBA
    • Excel Tips and Tricks
    • Excel Dashboards
    • Power Pivot & DAX
  • Power BI
  • Template Store
    • Ready to Use Templates
  • Courses
  • Academy
    • Excel + AI Mastery: 100 Formulas
    • Excel Pivot Tables & Dashboards
  • About Us
  • Contact Us

PK: An Excel Expert

Transforming Data into Decisions

Tag: Laboratory Performance Tracking

Power BI Templates

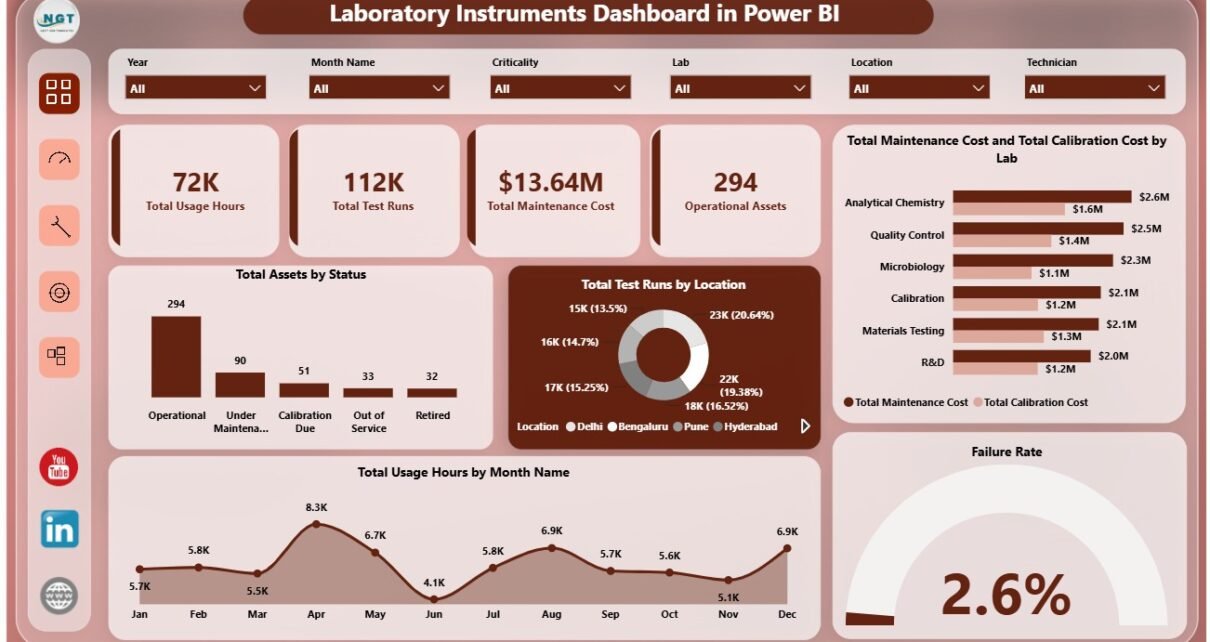
Laboratory Instruments Dashboard in Power BI

June 29, 2026June 29, 2026 PKComments Off on Laboratory Instruments Dashboard in Power BI
Laboratory Instruments Dashboard in Power BI is a ready-to-use PBIX reporting template for labs that need clearer visibility into instrument usage, test runs, maintenance cost, calibration cost, operational assets, downtime,
Read More
Dashboard Templates

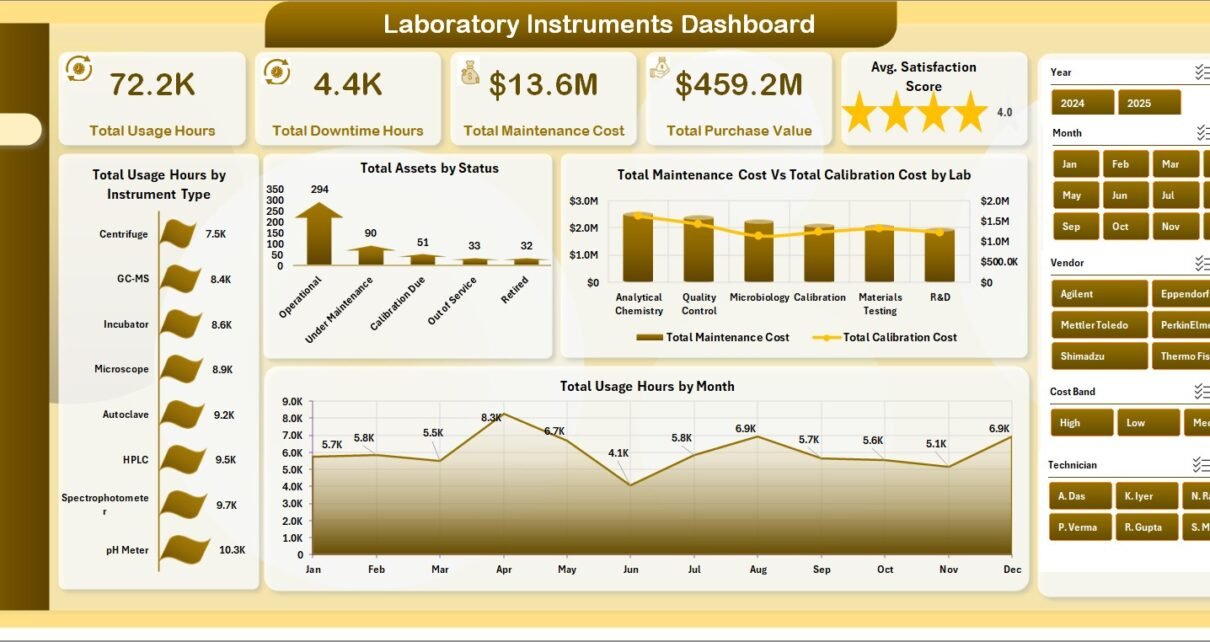
Laboratory Instruments Dashboard in Excel

June 29, 2026June 29, 2026 PKComments Off on Laboratory Instruments Dashboard in Excel
Laboratory Instruments Dashboard in Excel is a ready-to-use reporting template for labs that need clearer visibility into instrument usage, downtime, maintenance cost, calibration cost, asset value, test runs, and inventory
Read More
Dashboard Power BI

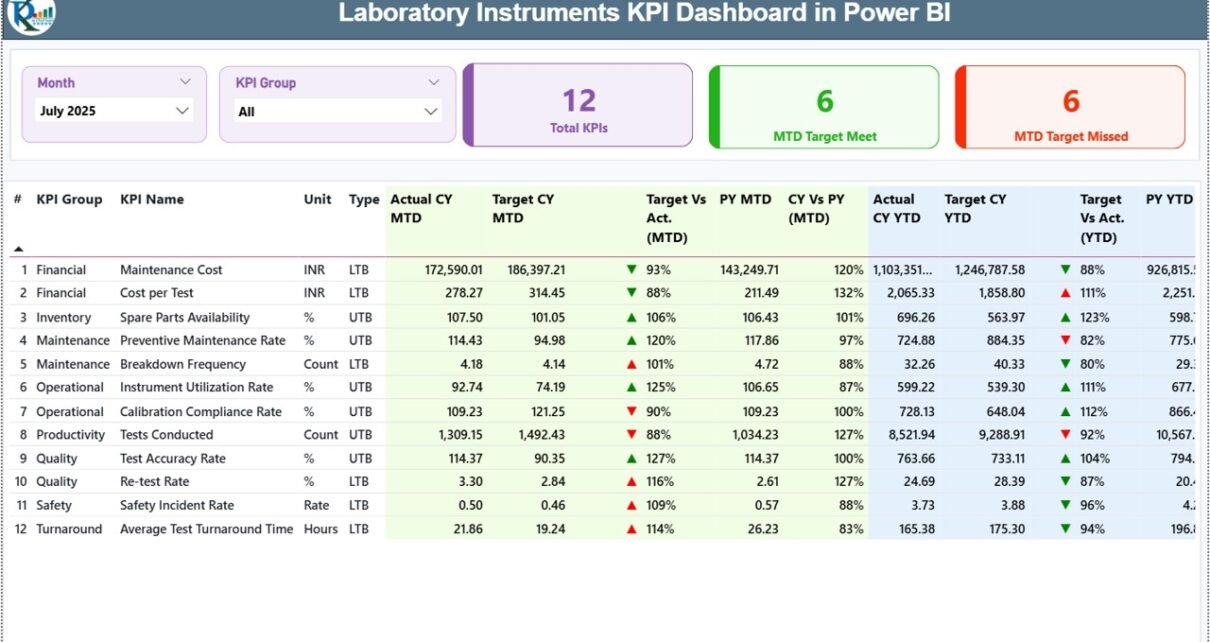
Laboratory Instruments KPI Dashboard in Power BI

February 11, 2026February 11, 2026 PKComments Off on Laboratory Instruments KPI Dashboard in Power BI
Laboratories depend on precision, speed, and compliance. However, many labs still track instrument performance manually. As a result, teams spend hours compiling reports. Moreover, managers struggle to monitor downtime, utilization
Read More
Dashboard

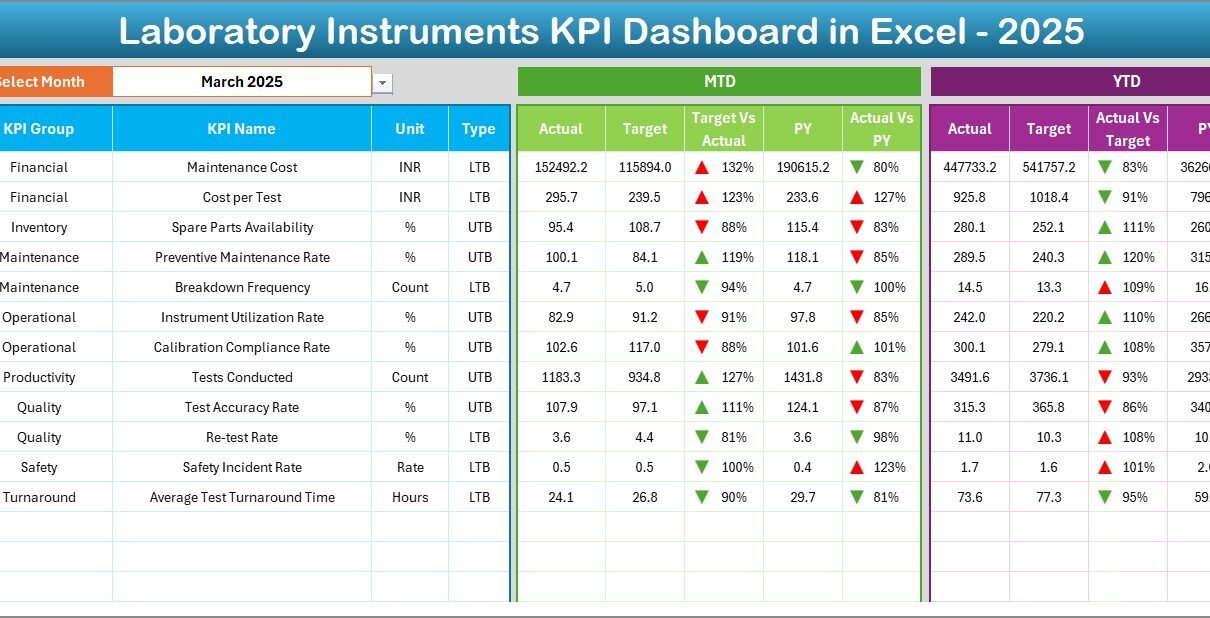
Laboratory Instruments KPI Dashboard in Excel

February 11, 2026February 11, 2026 PKComments Off on Laboratory Instruments KPI Dashboard in Excel
Laboratories run on accuracy, speed, and compliance. However, many labs still track instrument performance using scattered Excel files. As a result, managers struggle to monitor calibration schedules, downtime, utilization rates,
Read More
  • Learn Excel (Free Course)
    • 1. Shortcut Keys
    • 2. Fill & Flash Fill
    • 3. Find & Replace
    • 4. Sort & Filter
    • 5. Formulas & Functions
    • 6. Data Validation
    • 7. Conditional Formatting
    • 8. Basic Charts
    • 9. Advanced Charts
    • 10. Pivot Tables
    • 11. Excel Dashboards
    • 12. VBA Course
    • 13. Excel Formulas with AI
  • Templates
  • Tutorials
    • Charts and Visualization
    • VBA
    • Excel Tips and Tricks
    • Excel Dashboards
    • Power Pivot & DAX
  • Power BI
  • Template Store
    • Ready to Use Templates
  • Courses
  • Academy
    • Excel + AI Mastery: 100 Formulas
    • Excel Pivot Tables & Dashboards
  • About Us
  • Contact Us
Copyright © 2023 PK-AnExcelExpert.com - Privacy Policy