New: NextGenTemplates Academy - video courses on Excel formulas with AI and Pivot Tables & dashboards. Early-bird: 20% off with code EARLYBIRD20 - first 20 orders only. See the courses →
  • Learn Excel (Free Course)
    • 1. Shortcut Keys
    • 2. Fill & Flash Fill
    • 3. Find & Replace
    • 4. Sort & Filter
    • 5. Formulas & Functions
    • 6. Data Validation
    • 7. Conditional Formatting
    • 8. Basic Charts
    • 9. Advanced Charts
    • 10. Pivot Tables
    • 11. Excel Dashboards
    • 12. VBA Course
    • 13. Excel Formulas with AI
  • Templates
  • Tutorials
    • Charts and Visualization
    • VBA
    • Excel Tips and Tricks
    • Excel Dashboards
    • Power Pivot & DAX
  • Power BI
  • Template Store
    • Ready to Use Templates
  • Courses
  • Academy
    • Excel + AI Mastery: 100 Formulas
    • Excel Pivot Tables & Dashboards
  • About Us
  • Contact Us

PK: An Excel Expert

Transforming Data into Decisions

Tag: legal operations dashboard

Dashboard Power BI

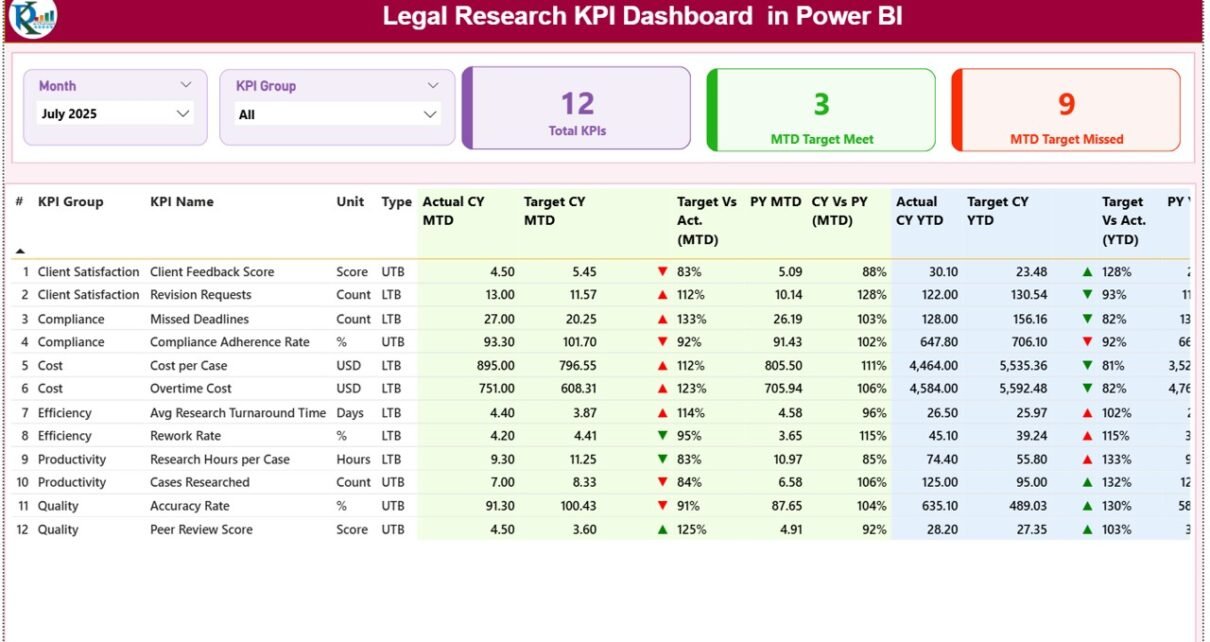
Legal Research KPI Dashboard in Power BI

January 31, 2026January 31, 2026 PKComments Off on Legal Research KPI Dashboard in Power BI
Legal research plays a critical role in law firms, corporate legal departments, and compliance teams. However, tracking legal research performance often becomes difficult when data stays scattered across Excel files,
Read More
Dashboard

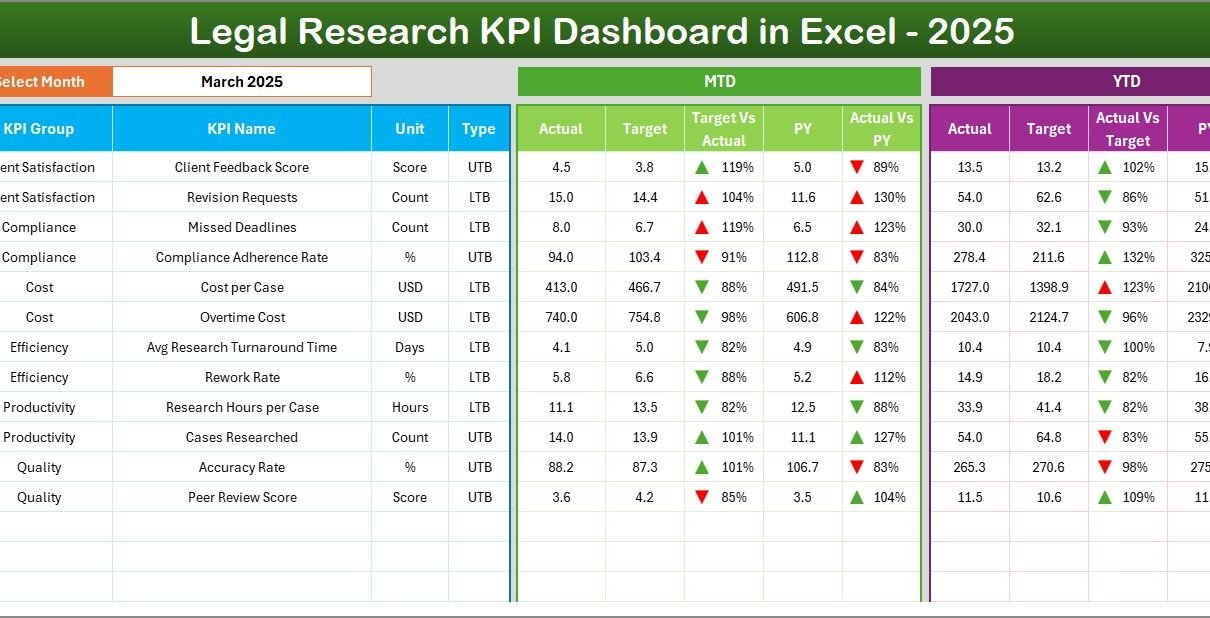
Legal Research KPI Dashboard in Excel

January 31, 2026January 31, 2026 PKComments Off on Legal Research KPI Dashboard in Excel
Legal research forms the backbone of strong legal opinions, case preparation, and compliance decisions. However, many legal teams still track research performance through emails, notes, or unstructured spreadsheets. As a
Read More
Dashboard Power BI

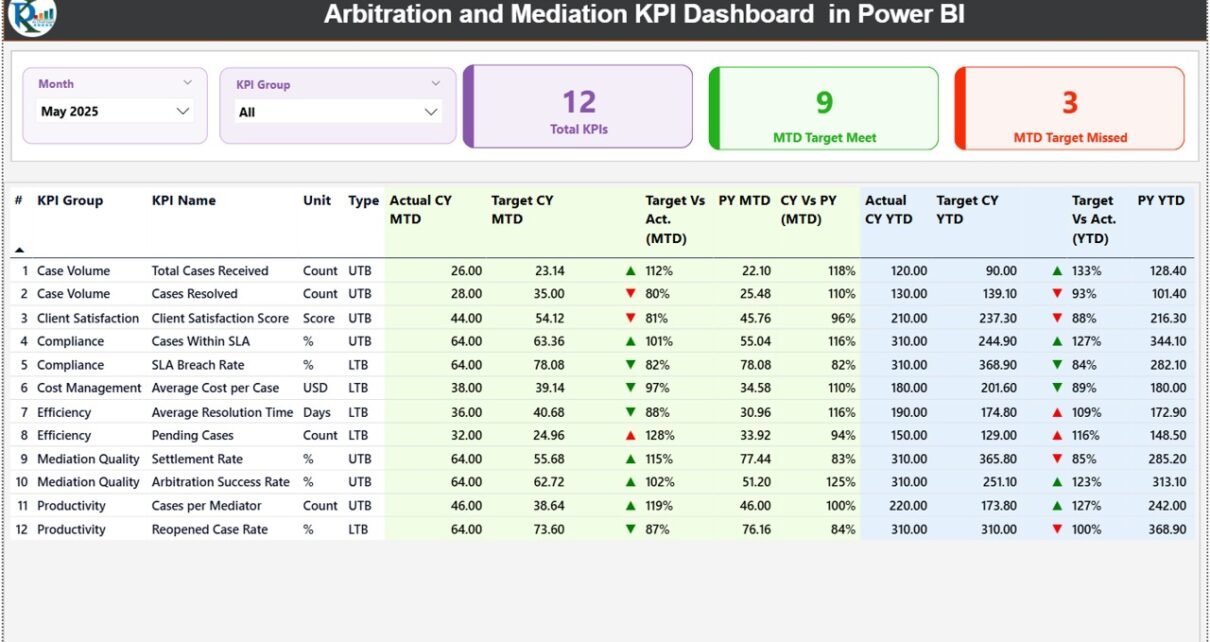
Arbitration and Mediation KPI Dashboard in Power BI

January 30, 2026January 30, 2026 PKComments Off on Arbitration and Mediation KPI Dashboard in Power BI
Arbitration and mediation play a crucial role in resolving disputes efficiently, fairly, and cost-effectively. However, when organizations manage dispute resolution using scattered Excel files, emails, or static reports, visibility drops
Read More
Dashboard

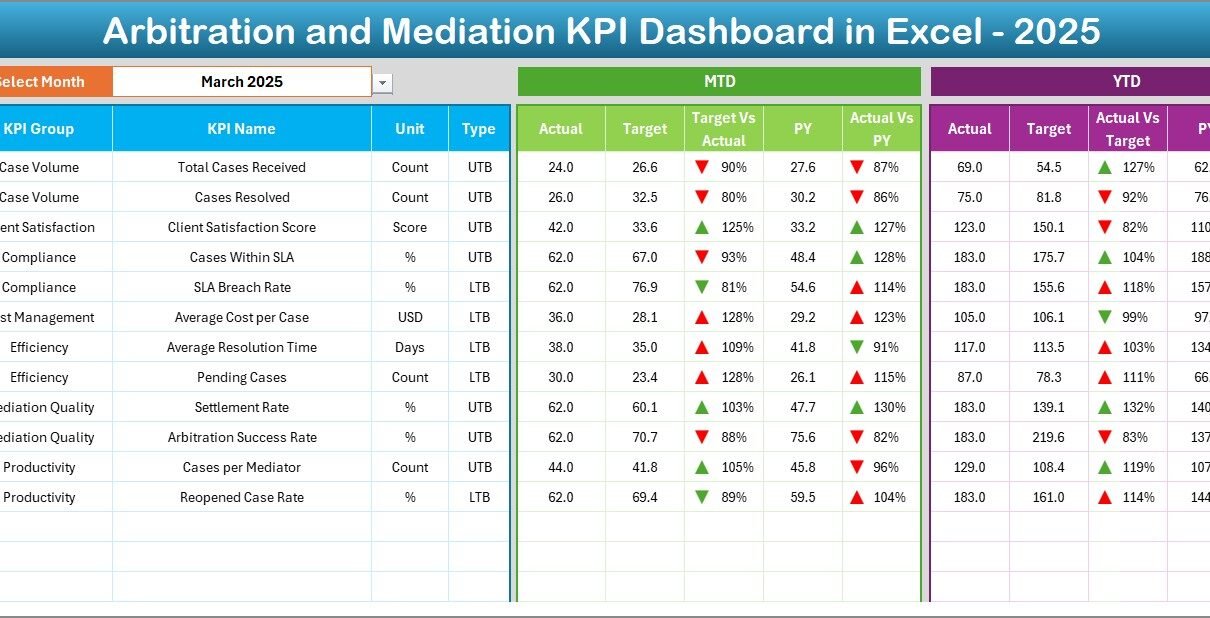
Arbitration and Mediation KPI Dashboard in Excel

January 30, 2026January 30, 2026 PKComments Off on Arbitration and Mediation KPI Dashboard in Excel
Arbitration and mediation play a vital role in resolving disputes efficiently, fairly, and cost-effectively. However, without proper measurement, organizations struggle to understand how well their dispute resolution processes perform. Therefore,
Read More
  • Learn Excel (Free Course)
    • 1. Shortcut Keys
    • 2. Fill & Flash Fill
    • 3. Find & Replace
    • 4. Sort & Filter
    • 5. Formulas & Functions
    • 6. Data Validation
    • 7. Conditional Formatting
    • 8. Basic Charts
    • 9. Advanced Charts
    • 10. Pivot Tables
    • 11. Excel Dashboards
    • 12. VBA Course
    • 13. Excel Formulas with AI
  • Templates
  • Tutorials
    • Charts and Visualization
    • VBA
    • Excel Tips and Tricks
    • Excel Dashboards
    • Power Pivot & DAX
  • Power BI
  • Template Store
    • Ready to Use Templates
  • Courses
  • Academy
    • Excel + AI Mastery: 100 Formulas
    • Excel Pivot Tables & Dashboards
  • About Us
  • Contact Us
Copyright © 2023 PK-AnExcelExpert.com - Privacy Policy