New: NextGenTemplates Academy - video courses on Excel formulas with AI and Pivot Tables & dashboards. Early-bird: 20% off with code EARLYBIRD20 - first 20 orders only. See the courses →
  • Learn Excel (Free Course)
    • 1. Shortcut Keys
    • 2. Fill & Flash Fill
    • 3. Find & Replace
    • 4. Sort & Filter
    • 5. Formulas & Functions
    • 6. Data Validation
    • 7. Conditional Formatting
    • 8. Basic Charts
    • 9. Advanced Charts
    • 10. Pivot Tables
    • 11. Excel Dashboards
    • 12. VBA Course
    • 13. Excel Formulas with AI
  • Templates
  • Tutorials
    • Charts and Visualization
    • VBA
    • Excel Tips and Tricks
    • Excel Dashboards
    • Power Pivot & DAX
  • Power BI
  • Template Store
    • Ready to Use Templates
  • Courses
  • Academy
    • Excel + AI Mastery: 100 Formulas
    • Excel Pivot Tables & Dashboards
  • About Us
  • Contact Us

PK: An Excel Expert

Transforming Data into Decisions

Tag: Manufacturing KPIs

Dashboard Power BI

Tool & Die Manufacturing KPI Dashboard in Power BI

December 20, 2025December 20, 2025 PKComments Off on Tool & Die Manufacturing KPI Dashboard in Power BI
Tool and die manufacturing plays a critical role in modern manufacturing ecosystems. Because precision, quality, cost control, and delivery timelines matter every single day, organizations must track performance consistently. However,
Read More
Dashboard Power BI

Wood & Furniture Manufacturing KPI Dashboard in Power BI

December 20, 2025December 20, 2025 PKComments Off on Wood & Furniture Manufacturing KPI Dashboard in Power BI
The wood and furniture manufacturing industry faces constant pressure to improve efficiency, control costs, reduce waste, and meet customer demand on time. Because margins remain tight and competition continues to
Read More
Dashboard Power BI

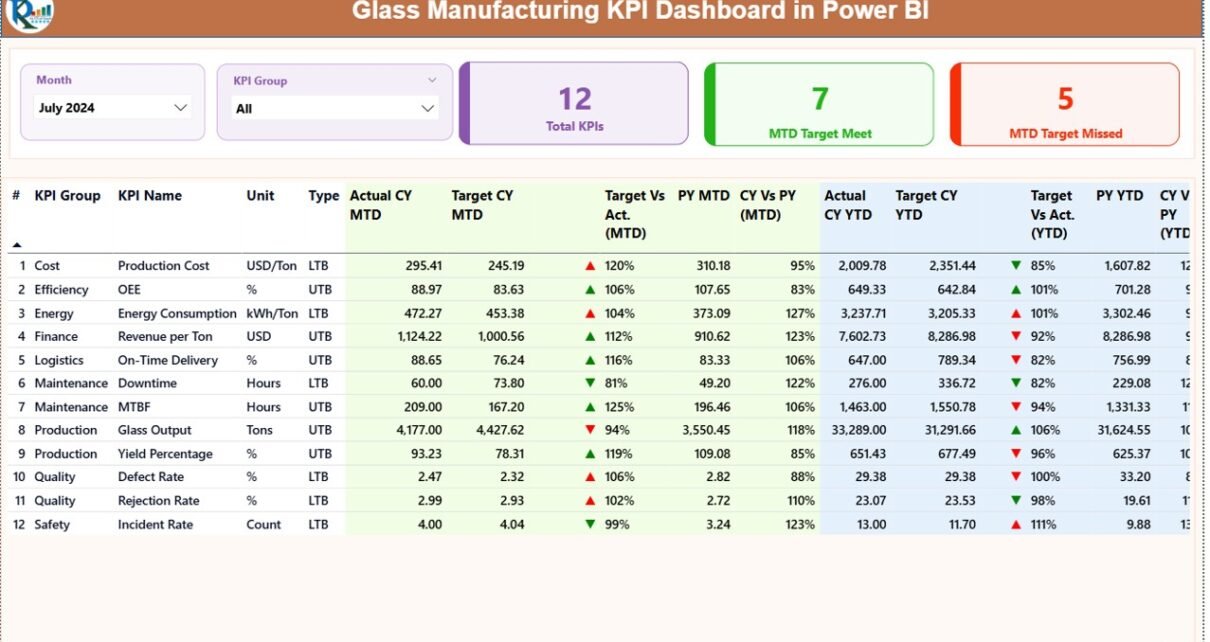
Glass Manufacturing KPI Dashboard in Power BI

December 19, 2025December 19, 2025 PKComments Off on Glass Manufacturing KPI Dashboard in Power BI
Glass manufacturing operates in a highly competitive and quality-sensitive environment. Manufacturers must control production efficiency, energy consumption, waste levels, quality defects, delivery timelines, and financial performance at the same time.
Read More
Dashboard Power BI

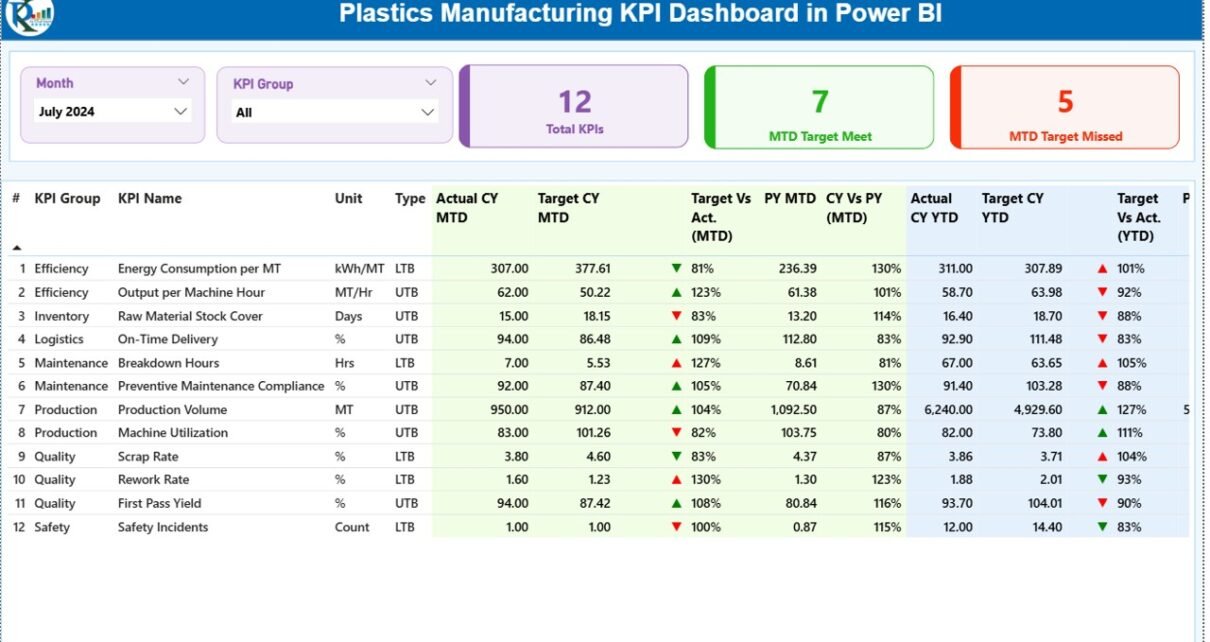
Plastics Manufacturing KPI Dashboard in Power BI

December 18, 2025December 18, 2025 PKComments Off on Plastics Manufacturing KPI Dashboard in Power BI
The plastics manufacturing industry faces constant pressure to improve productivity, control costs, reduce waste, and meet strict quality standards. However, many manufacturers still depend on manual Excel reports, delayed performance
Read More
Dashboard Power BI

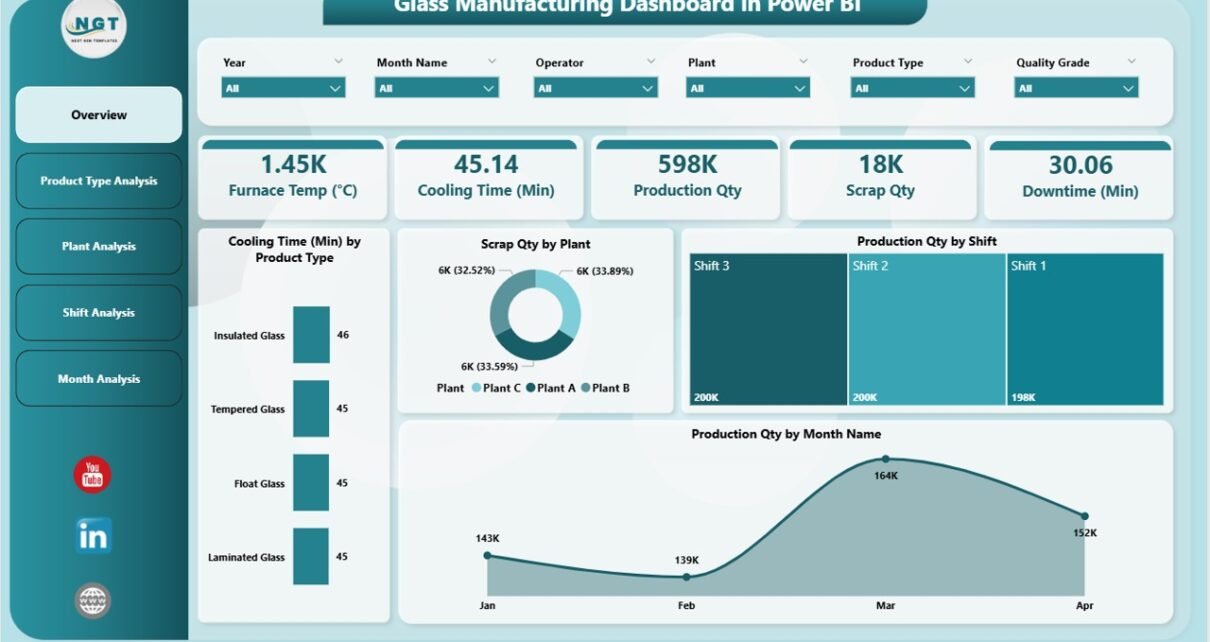
Glass Manufacturing Dashboard in Power BI

December 11, 2025December 11, 2025 PKComments Off on Glass Manufacturing Dashboard in Power BI
Running a glass manufacturing unit demands constant monitoring, quick decisions, and complete clarity over daily operations. Production teams deal with many challenges every single day—energy usage, furnace temperature, cooling time,
Read More
Dashboard

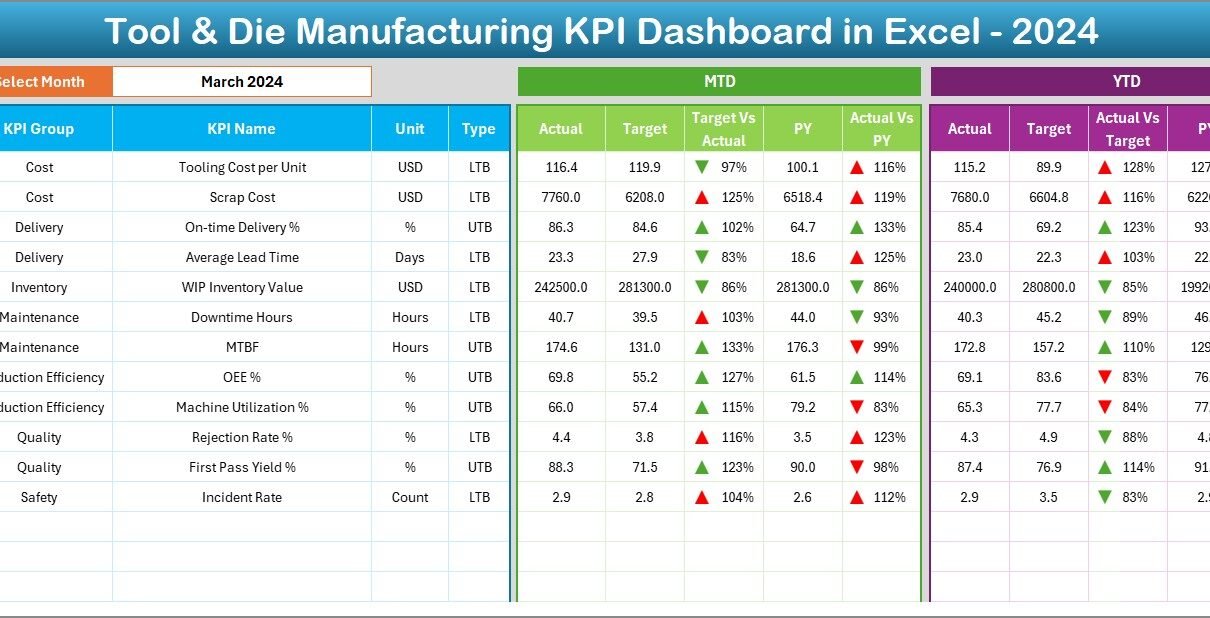
Tool & Die Manufacturing KPI Dashboard in Excel

December 11, 2025October 10, 2026 PKComments Off on Tool & Die Manufacturing KPI Dashboard in Excel
Tool and die manufacturing drives precision, accuracy, and efficiency for several industries. Automotive, aerospace, packaging, and engineering companies depend on high-quality tools and dies to run productions smoothly. Because of
Read More
Dashboard

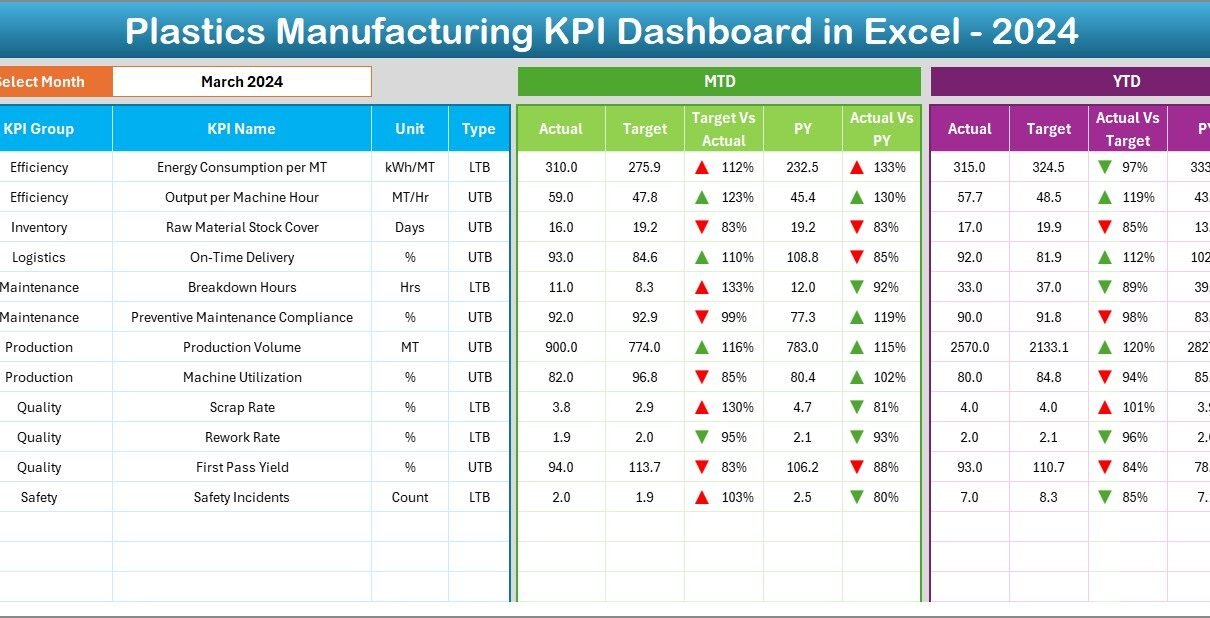
Plastics Manufacturing KPI Dashboard in Excel

December 8, 2025December 8, 2025 PKComments Off on Plastics Manufacturing KPI Dashboard in Excel
Manufacturing teams face continuous pressure to improve performance, reduce waste, and increase production speed. Plastics manufacturing adds even more challenges because quality, machine efficiency, material consumption, and scrap levels change
Read More
Dashboard

Seed & Fertilizer Manufacturing KPI Dashboard in Excel

December 5, 2025December 5, 2025 PKComments Off on Seed & Fertilizer Manufacturing KPI Dashboard in Excel
Seed and fertilizer manufacturing industries face constant pressure to improve productivity, reduce defects, optimize costs, and maintain high product quality. When operational data stays scattered across spreadsheets, emails, and manual
Read More
Dashboard

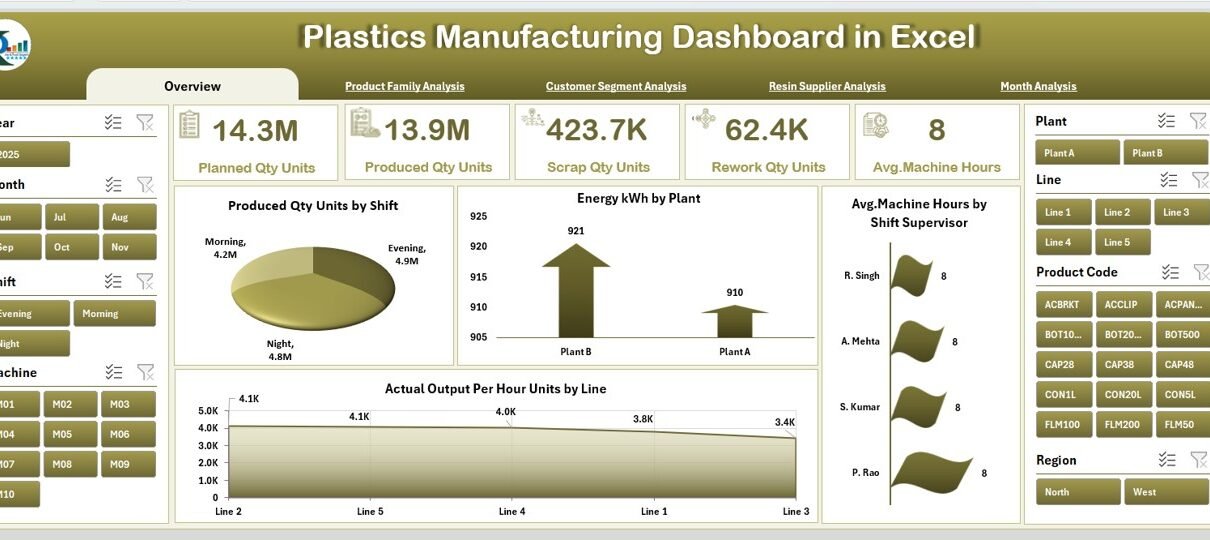
Plastics Manufacturing Dashboard in Excel

December 2, 2025December 2, 2025 PKComments Off on Plastics Manufacturing Dashboard in Excel
Plastics manufacturing plants run fast, complex, and highly repetitive operations every day. Teams must track production output, machine hours, energy usage, rework quantities, scrap, resin performance, shift-wise efficiency, and customer
Read More
Dashboard Power BI

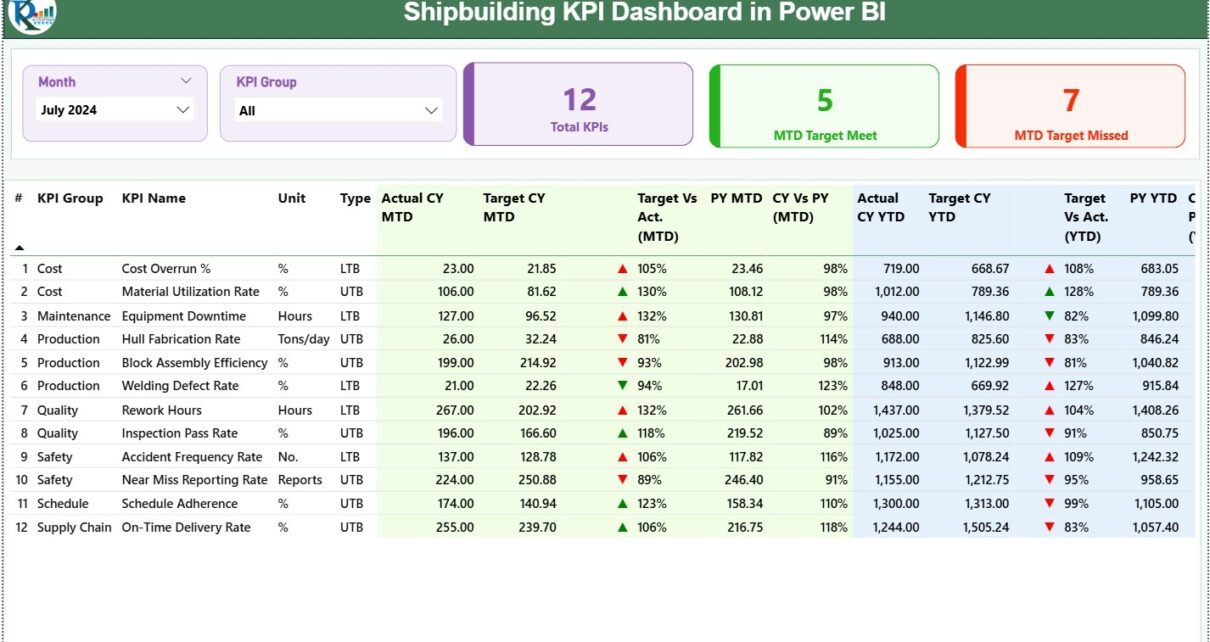
Shipbuilding KPI Dashboard in Power BI

December 2, 2025December 2, 2025 PKComments Off on Shipbuilding KPI Dashboard in Power BI
The shipbuilding industry manages some of the most complex engineering projects in the world. Shipyards track thousands of activities every day—from design, fabrication, welding, and assembly to safety checks, inspections,
Read More

Posts pagination

Previous 1 2 3 4 5 Next
  • Learn Excel (Free Course)
    • 1. Shortcut Keys
    • 2. Fill & Flash Fill
    • 3. Find & Replace
    • 4. Sort & Filter
    • 5. Formulas & Functions
    • 6. Data Validation
    • 7. Conditional Formatting
    • 8. Basic Charts
    • 9. Advanced Charts
    • 10. Pivot Tables
    • 11. Excel Dashboards
    • 12. VBA Course
    • 13. Excel Formulas with AI
  • Templates
  • Tutorials
    • Charts and Visualization
    • VBA
    • Excel Tips and Tricks
    • Excel Dashboards
    • Power Pivot & DAX
  • Power BI
  • Template Store
    • Ready to Use Templates
  • Courses
  • Academy
    • Excel + AI Mastery: 100 Formulas
    • Excel Pivot Tables & Dashboards
  • About Us
  • Contact Us
Copyright © 2023 PK-AnExcelExpert.com - Privacy Policy