New: NextGenTemplates Academy - video courses on Excel formulas with AI and Pivot Tables & dashboards. Early-bird: 20% off with code EARLYBIRD20 - first 20 orders only. See the courses →
  • Learn Excel (Free Course)
    • 1. Shortcut Keys
    • 2. Fill & Flash Fill
    • 3. Find & Replace
    • 4. Sort & Filter
    • 5. Formulas & Functions
    • 6. Data Validation
    • 7. Conditional Formatting
    • 8. Basic Charts
    • 9. Advanced Charts
    • 10. Pivot Tables
    • 11. Excel Dashboards
    • 12. VBA Course
    • 13. Excel Formulas with AI
  • Templates
  • Tutorials
    • Charts and Visualization
    • VBA
    • Excel Tips and Tricks
    • Excel Dashboards
    • Power Pivot & DAX
  • Power BI
  • Template Store
    • Ready to Use Templates
  • Courses
  • Academy
    • Excel + AI Mastery: 100 Formulas
    • Excel Pivot Tables & Dashboards
  • About Us
  • Contact Us

PK: An Excel Expert

Transforming Data into Decisions
Tag: maritime analytics

Dashboard Power BI

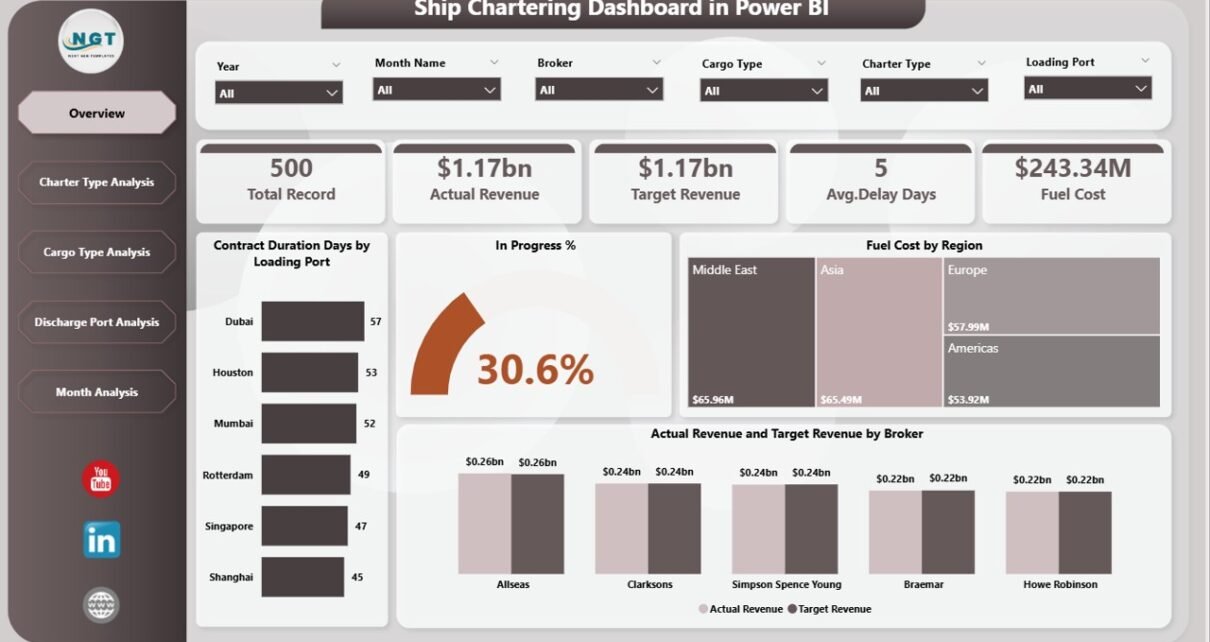
Ship Chartering Dashboard in Power BI

March 6, 2026March 6, 2026 PKComments Off on Ship Chartering Dashboard in Power BI
The global maritime industry plays a crucial role in international trade. Every day, thousands of vessels transport commodities such as crude oil, coal, iron ore, grains, fertilizers, and manufactured goods
Read More
Dashboard Power BI

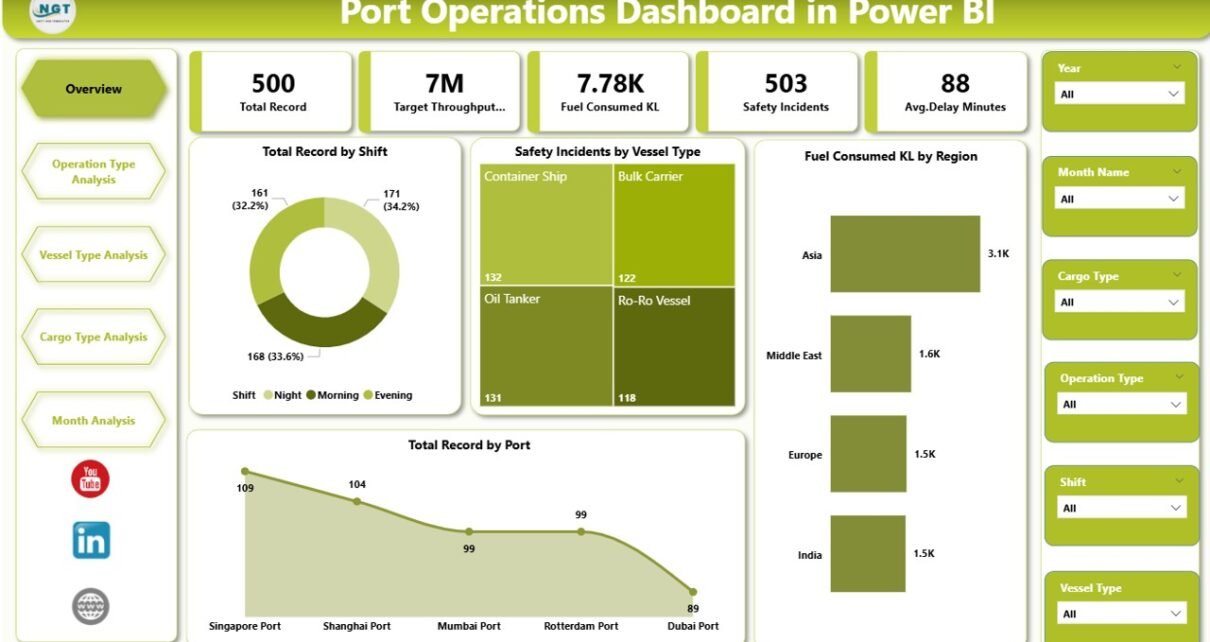
Port Operations Dashboard in Power BI

March 6, 2026March 6, 2026 PKComments Off on Port Operations Dashboard in Power BI
Modern ports handle thousands of vessel movements, cargo shipments, and logistics operations every day. Therefore, port authorities, shipping companies, and logistics managers must constantly monitor operational performance, safety metrics, fuel
Read More
Dashboard

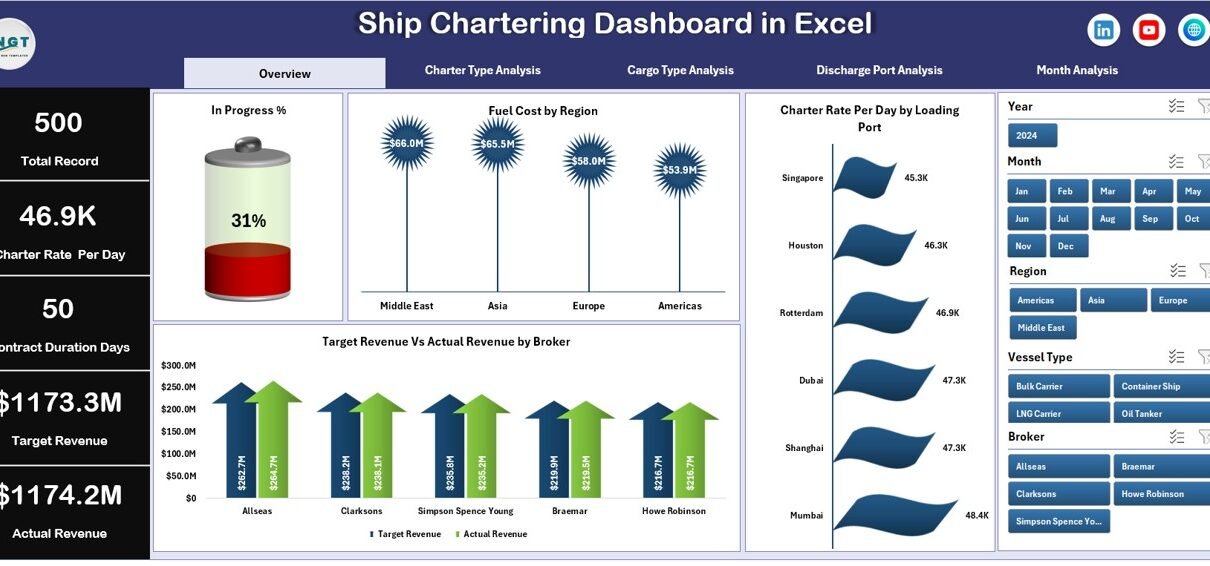
Ship Chartering Dashboard in Excel

March 6, 2026March 6, 2026 PKComments Off on Ship Chartering Dashboard in Excel
The maritime shipping industry plays a vital role in global trade. Every day, shipping companies transport millions of tons of cargo across oceans. However, managing ship chartering operations can become
Read More
Dashboard

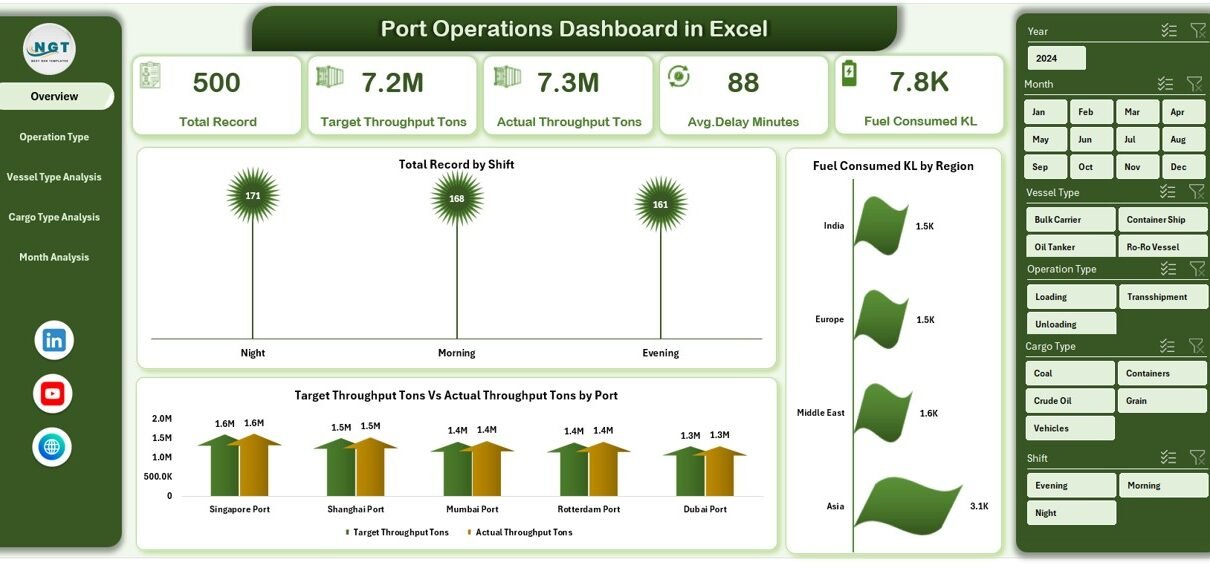
Port Operations Dashboard in Excel

March 6, 2026March 6, 2026 PKComments Off on Port Operations Dashboard in Excel
Ports play a crucial role in global trade and logistics. Every day, ports handle thousands of vessels, cargo shipments, fuel operations, and logistics activities. Therefore, port authorities and operations teams
Read More
Dashboard

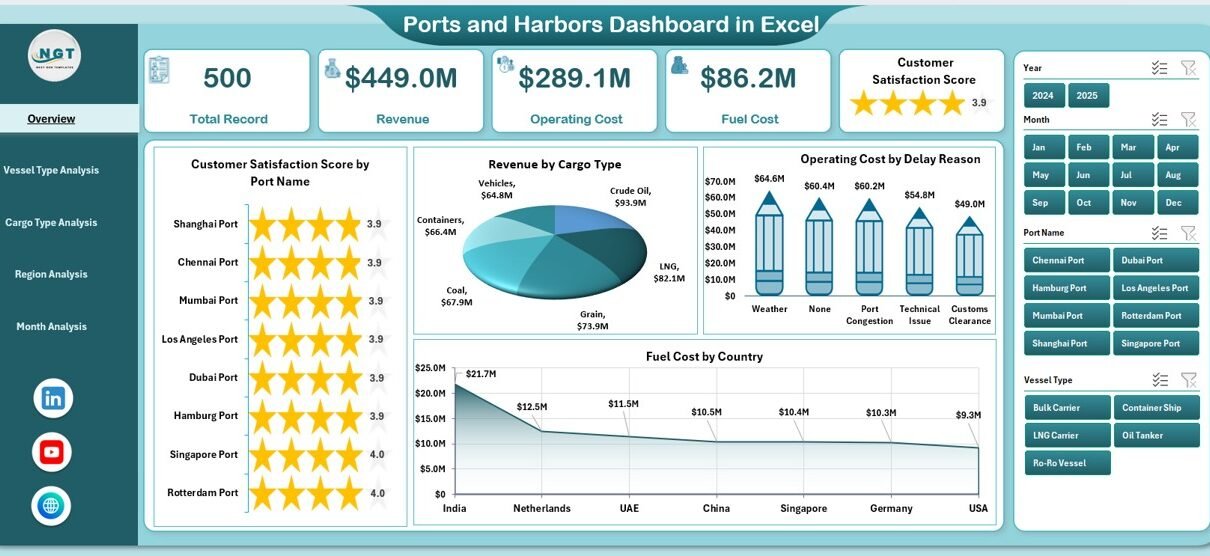
Ports and Harbors Dashboard in Excel

February 17, 2026February 17, 2026 PKComments Off on Ports and Harbors Dashboard in Excel
Managing ports and harbors involves complex operations. Every day, vessels arrive, cargo moves, fuel costs fluctuate, and operating expenses change. Therefore, port authorities and logistics managers must track performance in
Read More
Power BI

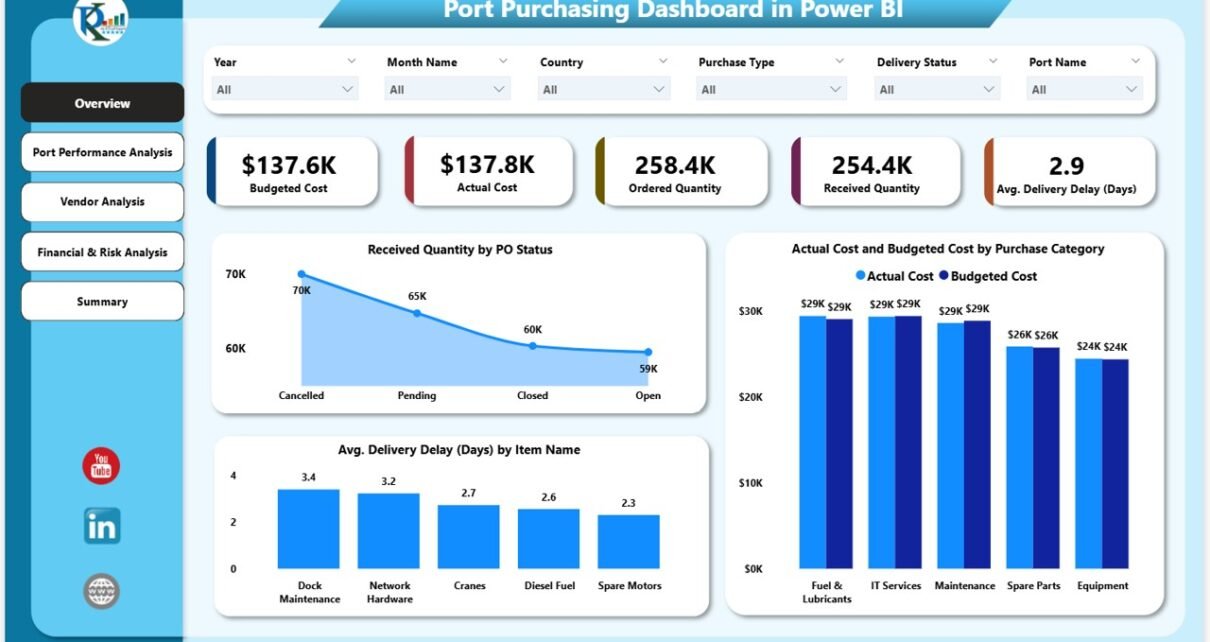
Port Purchasing Dashboard in Power BI

December 27, 2025December 27, 2025 PKComments Off on Port Purchasing Dashboard in Power BI
Ports handle massive purchasing volumes every day. From equipment and spare parts to fuel, services, and infrastructure materials, every purchase affects operational efficiency, cost control, and delivery timelines. However, when
Read More
Power BI

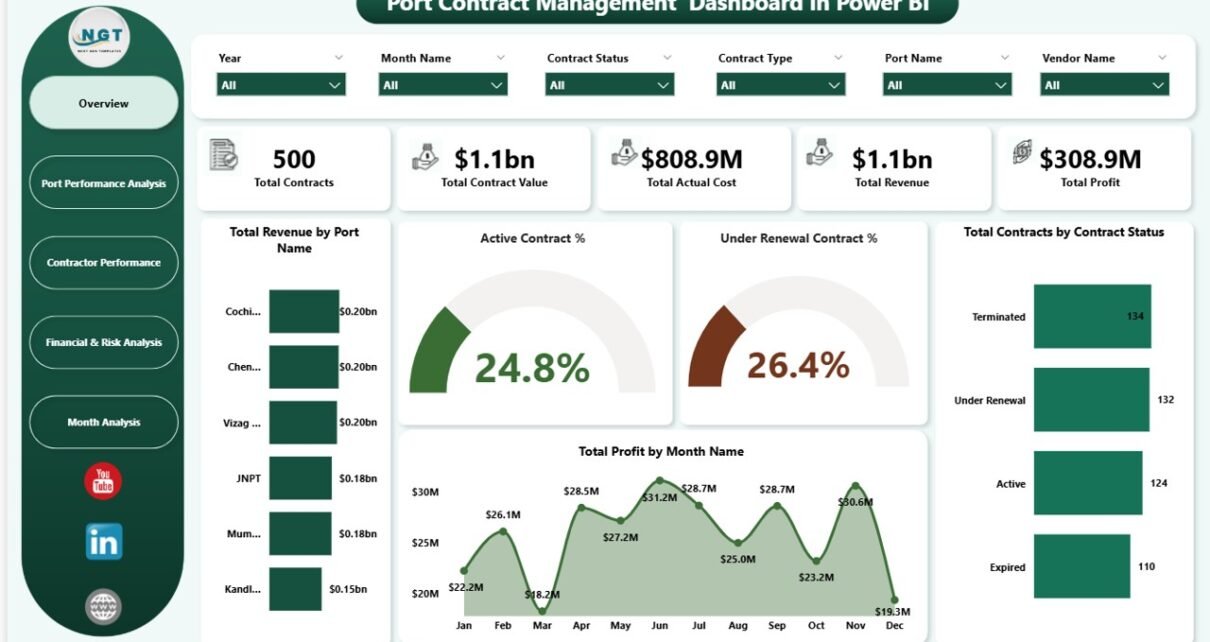
Port Contract Management Dashboard in Power BI

December 24, 2025December 24, 2025 PKComments Off on Port Contract Management Dashboard in Power BI
Managing port contracts involves high-value agreements, multiple vendors, long durations, and strict performance tracking. Ports handle contracts related to terminal operations, logistics, cargo handling, maintenance, dredging, security, and infrastructure services.
Read More
Power BI

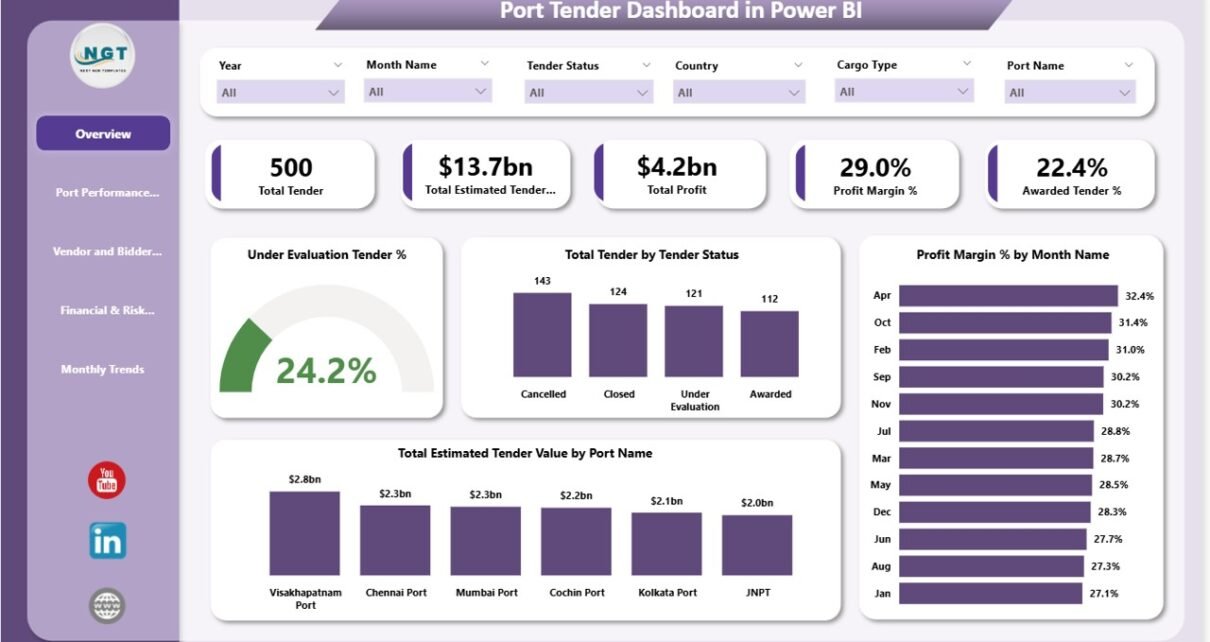
Port Tender Dashboard in Power BI

December 23, 2025December 23, 2025 PKComments Off on Port Tender Dashboard in Power BI
Port authorities, logistics companies, and infrastructure contractors handle complex tender processes every year. These tenders involve large contract values, multiple bidders, varying cargo types, long bid cycles, and significant financial
Read More
Dashboard Power BI

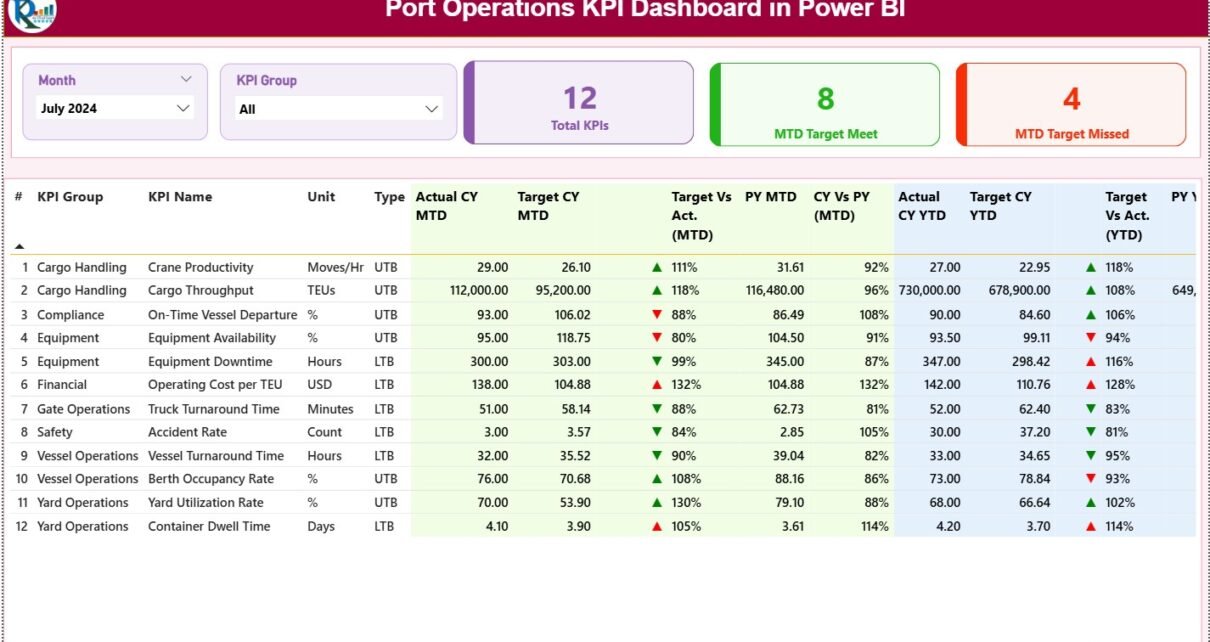
Port Operations KPI Dashboard in Power BI

December 19, 2025December 19, 2025 PKComments Off on Port Operations KPI Dashboard in Power BI
Port operations play a critical role in global trade. Every delay, inefficiency, or missed target directly affects shipping schedules, logistics costs, and customer satisfaction. Therefore, port authorities, terminal operators, and
Read More
Dashboard

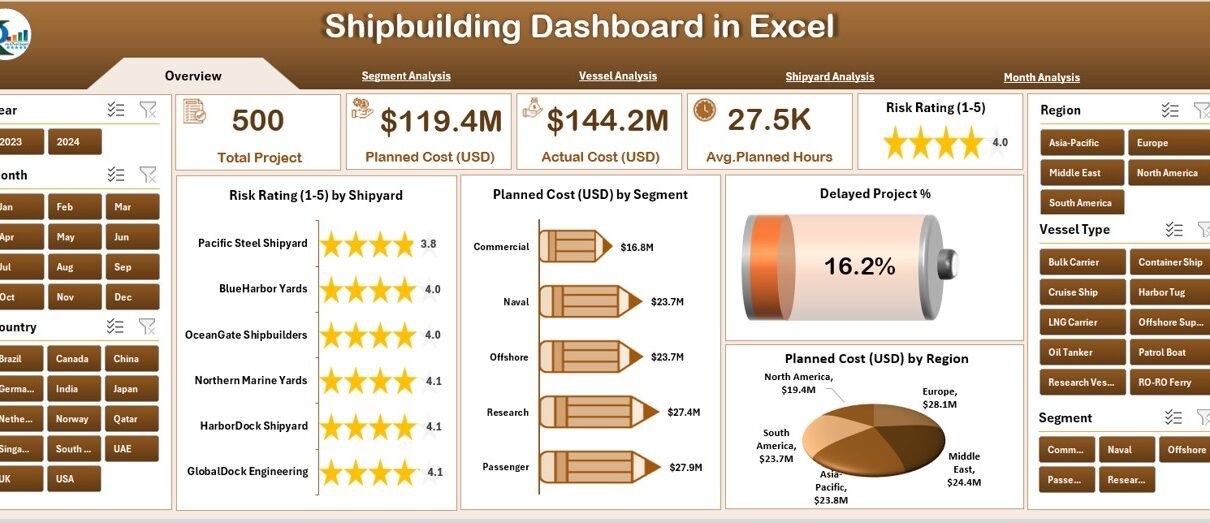
Shipbuilding Dashboard in Excel

December 4, 2025December 4, 2025 PKComments Off on Shipbuilding Dashboard in Excel
The shipbuilding industry manages some of the world’s most complex, expensive, and time-sensitive projects. Every vessel requires thousands of tasks, multiple shipyards, several engineering teams, strict safety rules, and continuous
Read More

Posts pagination

1 2 Next
  • Learn Excel (Free Course)
    • 1. Shortcut Keys
    • 2. Fill & Flash Fill
    • 3. Find & Replace
    • 4. Sort & Filter
    • 5. Formulas & Functions
    • 6. Data Validation
    • 7. Conditional Formatting
    • 8. Basic Charts
    • 9. Advanced Charts
    • 10. Pivot Tables
    • 11. Excel Dashboards
    • 12. VBA Course
    • 13. Excel Formulas with AI
  • Templates
  • Tutorials
    • Charts and Visualization
    • VBA
    • Excel Tips and Tricks
    • Excel Dashboards
    • Power Pivot & DAX
  • Power BI
  • Template Store
    • Ready to Use Templates
  • Courses
  • Academy
    • Excel + AI Mastery: 100 Formulas
    • Excel Pivot Tables & Dashboards
  • About Us
  • Contact Us
Copyright © 2023 PK-AnExcelExpert.com - Privacy Policy