New: NextGenTemplates Academy - video courses on Excel formulas with AI and Pivot Tables & dashboards. Early-bird: 20% off with code EARLYBIRD20 - first 20 orders only. See the courses →
  • Learn Excel (Free Course)
    • 1. Shortcut Keys
    • 2. Fill & Flash Fill
    • 3. Find & Replace
    • 4. Sort & Filter
    • 5. Formulas & Functions
    • 6. Data Validation
    • 7. Conditional Formatting
    • 8. Basic Charts
    • 9. Advanced Charts
    • 10. Pivot Tables
    • 11. Excel Dashboards
    • 12. VBA Course
    • 13. Excel Formulas with AI
  • Templates
  • Tutorials
    • Charts and Visualization
    • VBA
    • Excel Tips and Tricks
    • Excel Dashboards
    • Power Pivot & DAX
  • Power BI
  • Template Store
    • Ready to Use Templates
  • Courses
  • Academy
    • Excel + AI Mastery: 100 Formulas
    • Excel Pivot Tables & Dashboards
  • About Us
  • Contact Us

PK: An Excel Expert

Transforming Data into Decisions
Tag: Marketing Analytics

Dashboard

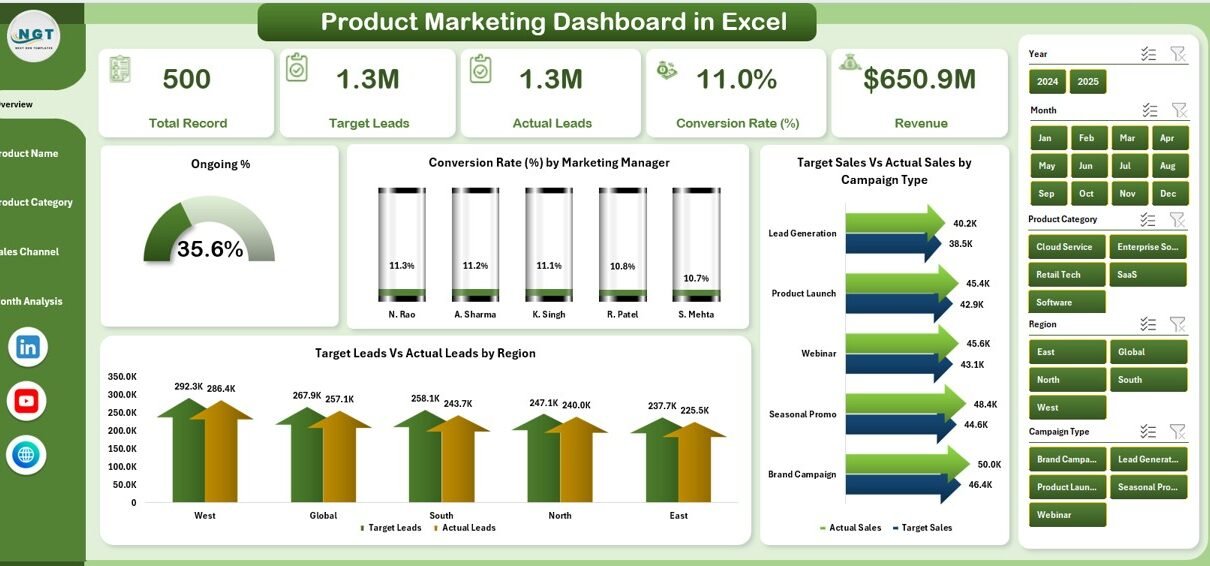
Product Marketing Dashboard in Excel

February 10, 2026February 10, 2026 PKComments Off on Product Marketing Dashboard in Excel
In today’s competitive market, companies must track campaigns, leads, revenue, and conversion rates in real time. However, many marketing teams still rely on scattered Excel sheets. As a result, managers
Read More
Dashboard Power BI

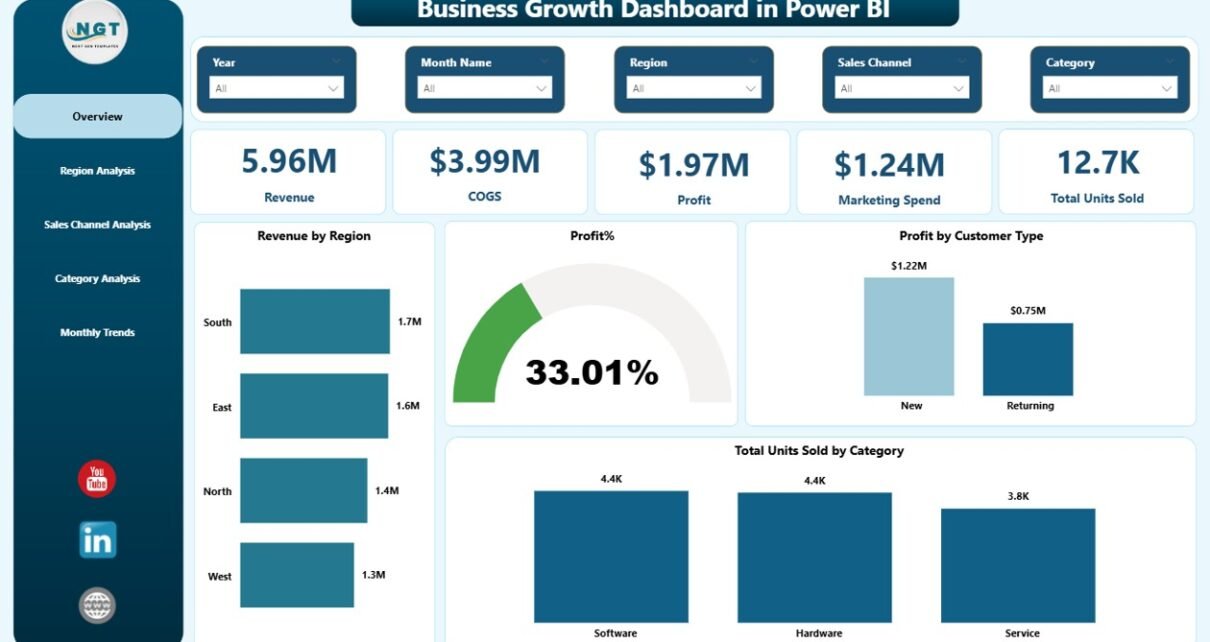
Business Growth Dashboard in Power BI

February 8, 2026February 8, 2026 PKComments Off on Business Growth Dashboard in Power BI
In today’s competitive market, businesses must move fast. Markets change quickly. Customer preferences shift constantly. Costs rise unexpectedly. Therefore, companies must track performance in real time. However, many organizations still
Read More
Dashboard Power BI

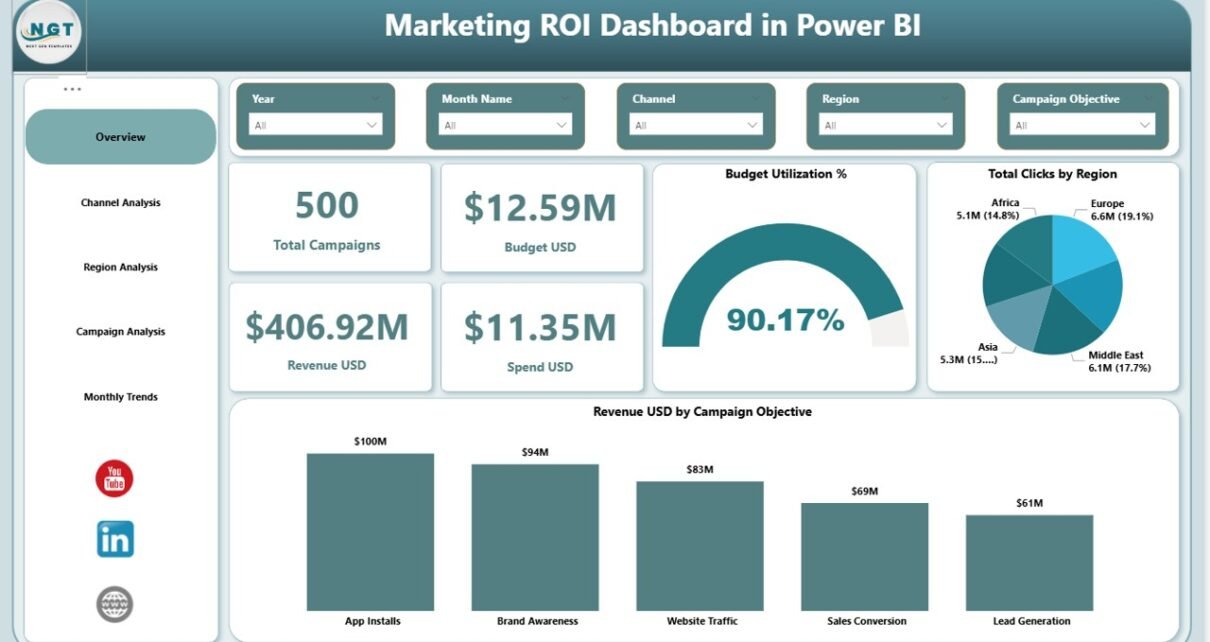
Marketing ROI Dashboard in Power BI

February 2, 2026February 2, 2026 PKComments Off on Marketing ROI Dashboard in Power BI
Marketing teams invest heavily in campaigns, channels, and regions. However, without a clear measurement system, budgets often disappear without clear results. Because of this challenge, organizations now rely on analytics-driven
Read More
Dashboard

Market Research Dashboard in Excel

January 17, 2026January 17, 2026 PKComments Off on Market Research Dashboard in Excel
Market research drives every successful business decision. Companies that understand customer needs, pricing sensitivity, satisfaction levels, and regional trends always stay ahead of competitors. However, raw survey data in Excel
Read More
Dashboard Power BI

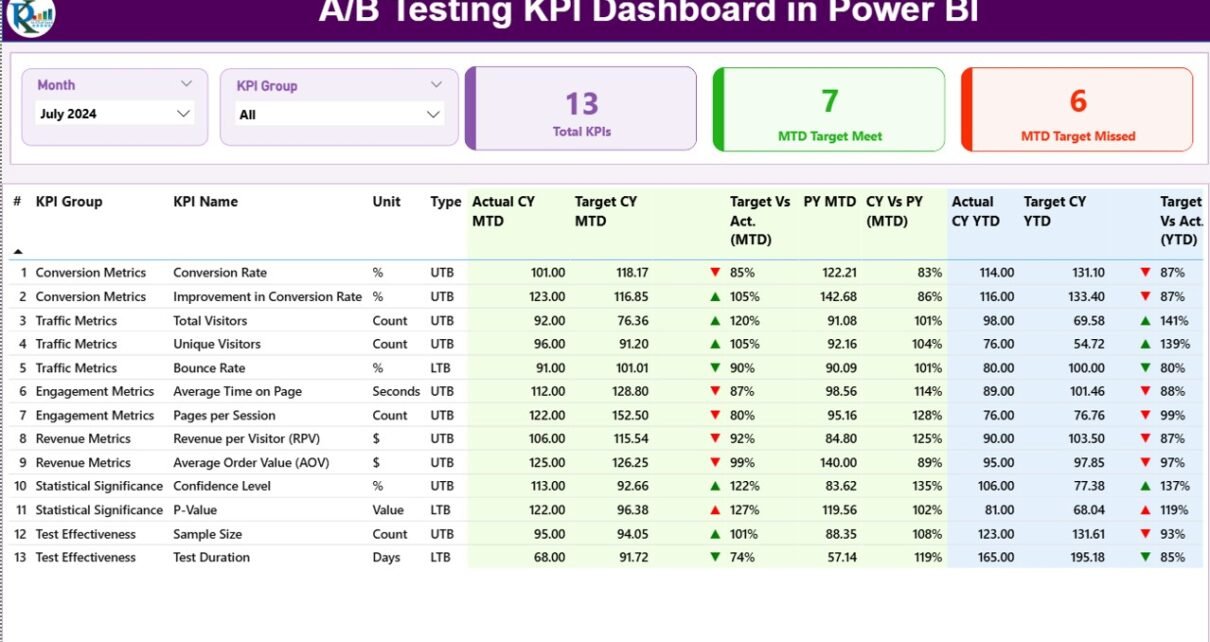
A/B Testing KPI Dashboard in Power BI

December 22, 2025December 22, 2025 PKComments Off on A/B Testing KPI Dashboard in Power BI
A/B testing sits at the heart of modern digital decision-making. Whether you optimize websites, mobile apps, email campaigns, pricing strategies, or product features, you rely on experiments to prove what
Read More
Dashboard Power BI

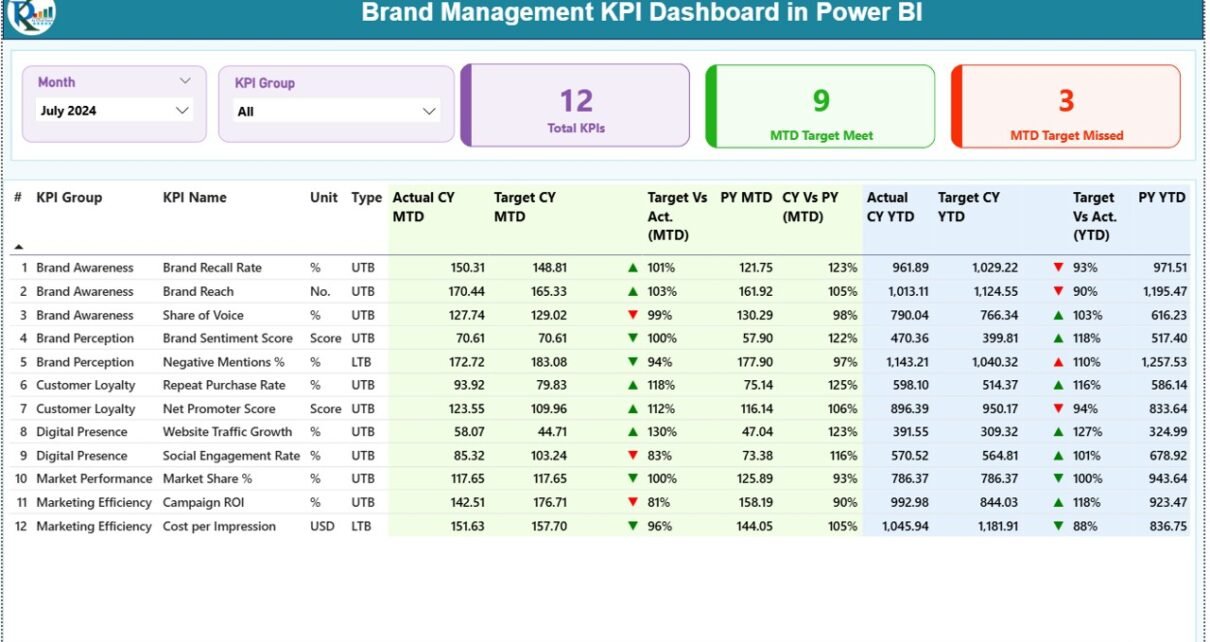
Brand Management KPI Dashboard in Power BI

December 17, 2025December 17, 2025 PKComments Off on Brand Management KPI Dashboard in Power BI
Brand building no longer depends only on creativity, logos, or advertising slogans. Instead, successful brands grow because leaders track performance, measure perception, and act quickly on data. Therefore, a Brand
Read More
Dashboard Power BI

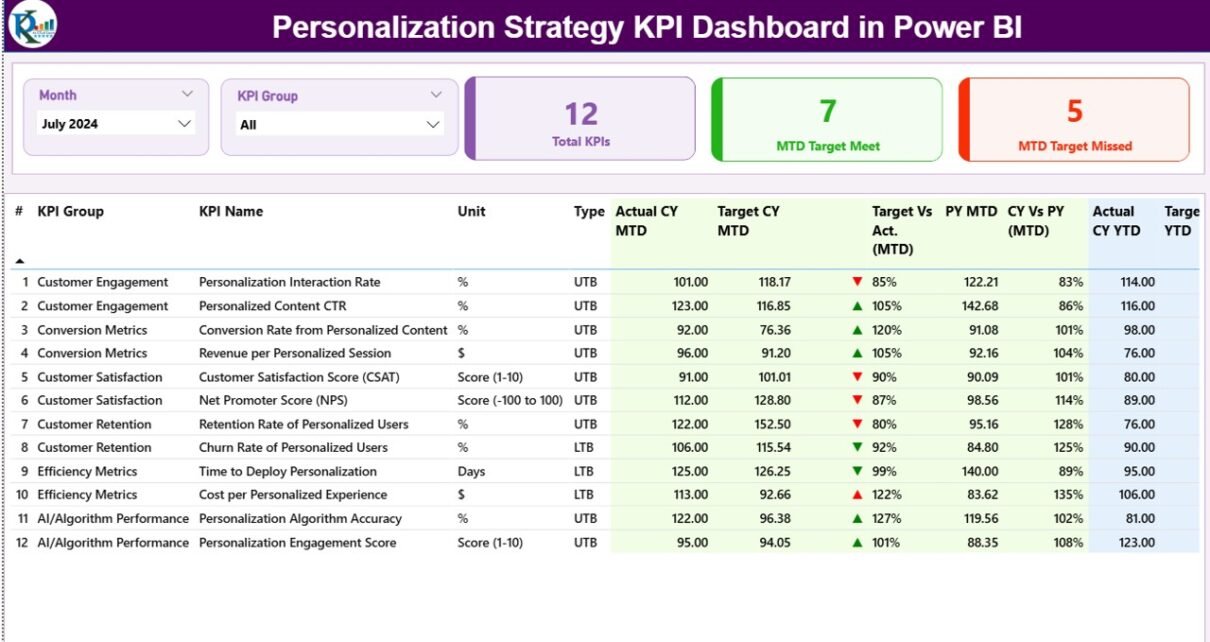
Personalization Strategy KPI Dashboard in Power BI

December 17, 2025December 17, 2025 PKComments Off on Personalization Strategy KPI Dashboard in Power BI
In today’s competitive digital environment, personalization no longer remains optional. Instead, it has become a core business strategy. However, personalization efforts fail when organizations do not measure them correctly. Therefore,
Read More
Dashboard Power BI

Pop-up Stores Dashboard in Power BI

December 16, 2025December 16, 2025 PKComments Off on Pop-up Stores Dashboard in Power BI
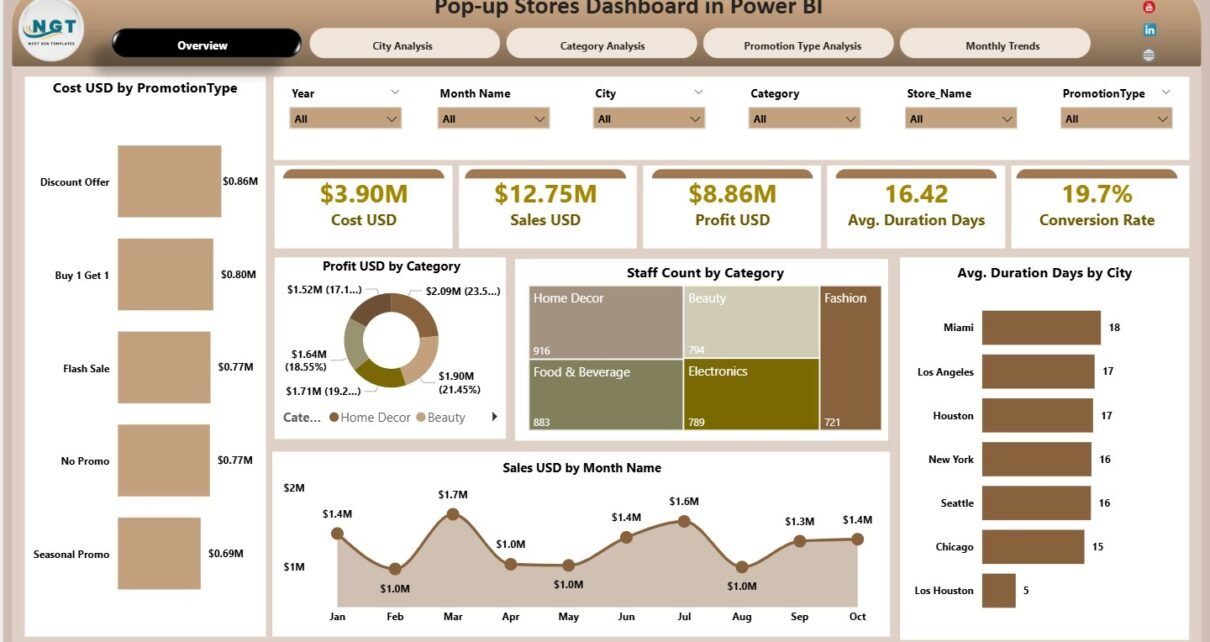
Pop-up stores have become a powerful retail strategy for brands that want flexibility, fast market entry, and high customer engagement. However, because pop-up stores operate for a limited time, performance
Read More
Dashboard Power BI

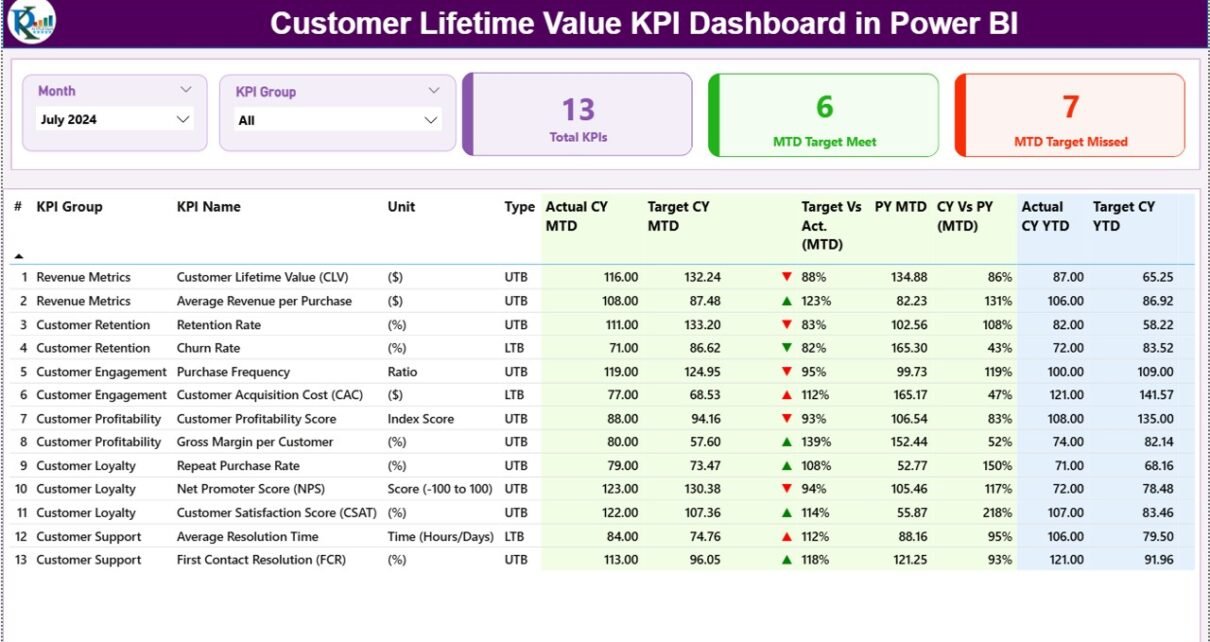
Customer Lifetime Value KPI Dashboard in Power BI

December 16, 2025December 16, 2025 PKComments Off on Customer Lifetime Value KPI Dashboard in Power BI
Managing customers is no longer just about acquiring new leads. Instead, modern businesses focus on maximizing the long-term value of each customer. Therefore, organizations need a clear, data-driven way to
Read More
Power BI

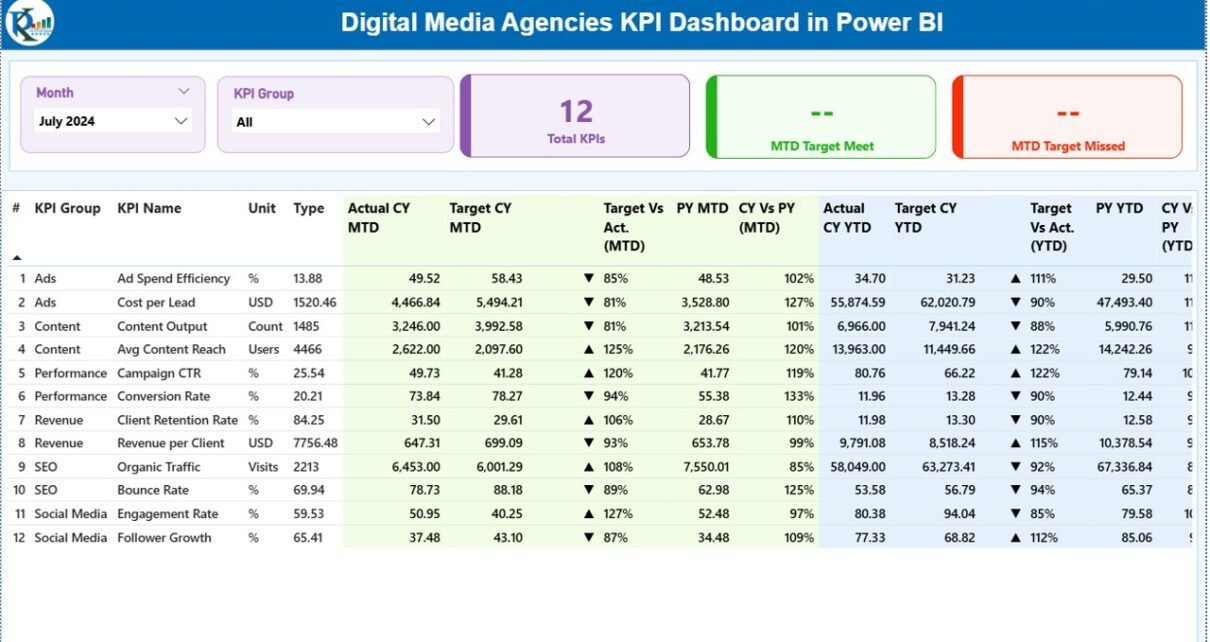
Digital Media Agencies KPI Dashboard in Power BI

December 13, 2025December 13, 2025 PKComments Off on Digital Media Agencies KPI Dashboard in Power BI
In today’s fast-moving digital world, digital media agencies must track performance continuously. Campaign results change daily, client expectations rise constantly, and competition grows stronger every month. Therefore, agencies need a
Read More

Posts pagination

Previous 1 2 3 … 5 Next
  • Learn Excel (Free Course)
    • 1. Shortcut Keys
    • 2. Fill & Flash Fill
    • 3. Find & Replace
    • 4. Sort & Filter
    • 5. Formulas & Functions
    • 6. Data Validation
    • 7. Conditional Formatting
    • 8. Basic Charts
    • 9. Advanced Charts
    • 10. Pivot Tables
    • 11. Excel Dashboards
    • 12. VBA Course
    • 13. Excel Formulas with AI
  • Templates
  • Tutorials
    • Charts and Visualization
    • VBA
    • Excel Tips and Tricks
    • Excel Dashboards
    • Power Pivot & DAX
  • Power BI
  • Template Store
    • Ready to Use Templates
  • Courses
  • Academy
    • Excel + AI Mastery: 100 Formulas
    • Excel Pivot Tables & Dashboards
  • About Us
  • Contact Us
Copyright © 2023 PK-AnExcelExpert.com - Privacy Policy