New: NextGenTemplates Academy - video courses on Excel formulas with AI and Pivot Tables & dashboards. Early-bird: 20% off with code EARLYBIRD20 - first 20 orders only. See the courses →
  • Learn Excel (Free Course)
    • 1. Shortcut Keys
    • 2. Fill & Flash Fill
    • 3. Find & Replace
    • 4. Sort & Filter
    • 5. Formulas & Functions
    • 6. Data Validation
    • 7. Conditional Formatting
    • 8. Basic Charts
    • 9. Advanced Charts
    • 10. Pivot Tables
    • 11. Excel Dashboards
    • 12. VBA Course
    • 13. Excel Formulas with AI
  • Templates
  • Tutorials
    • Charts and Visualization
    • VBA
    • Excel Tips and Tricks
    • Excel Dashboards
    • Power Pivot & DAX
  • Power BI
  • Template Store
    • Ready to Use Templates
  • Courses
  • Academy
    • Excel + AI Mastery: 100 Formulas
    • Excel Pivot Tables & Dashboards
  • About Us
  • Contact Us

PK: An Excel Expert

Transforming Data into Decisions

Tag: Metro Rail Analytics

Dashboard

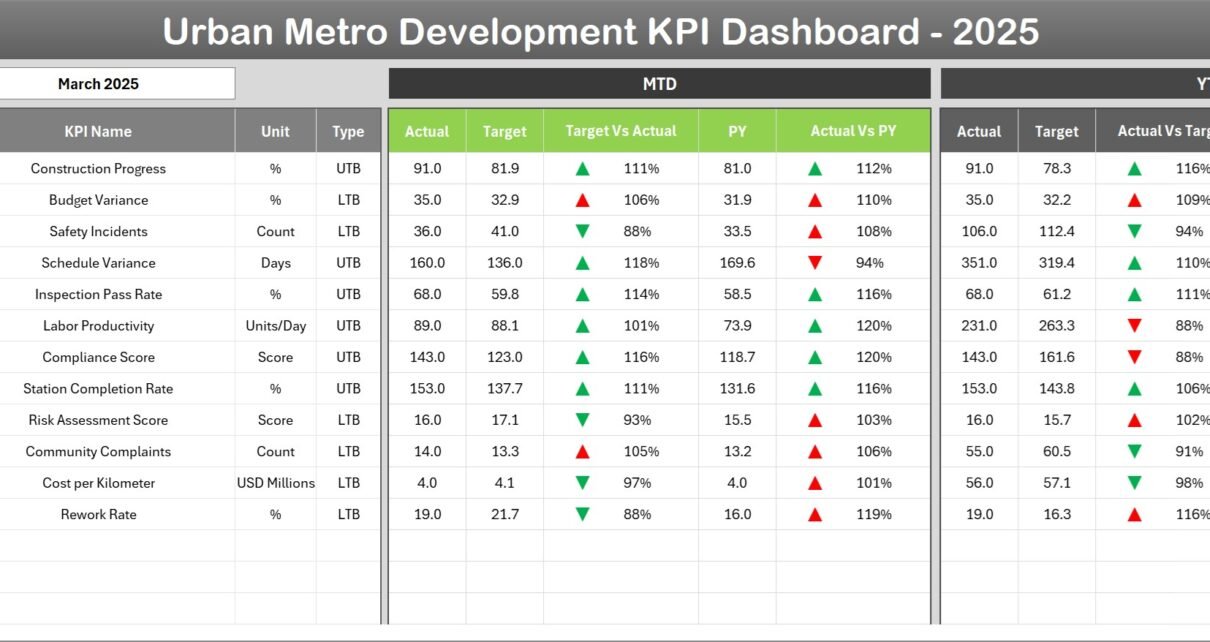
Urban Metro Development KPI Dashboard in Excel

March 8, 2026March 8, 2026 PKComments Off on Urban Metro Development KPI Dashboard in Excel
Urban metro systems play a crucial role in modern cities. As urban populations grow rapidly, governments and transportation authorities must manage complex metro infrastructure projects efficiently. These projects involve multiple
Read More
Dashboard Power BI

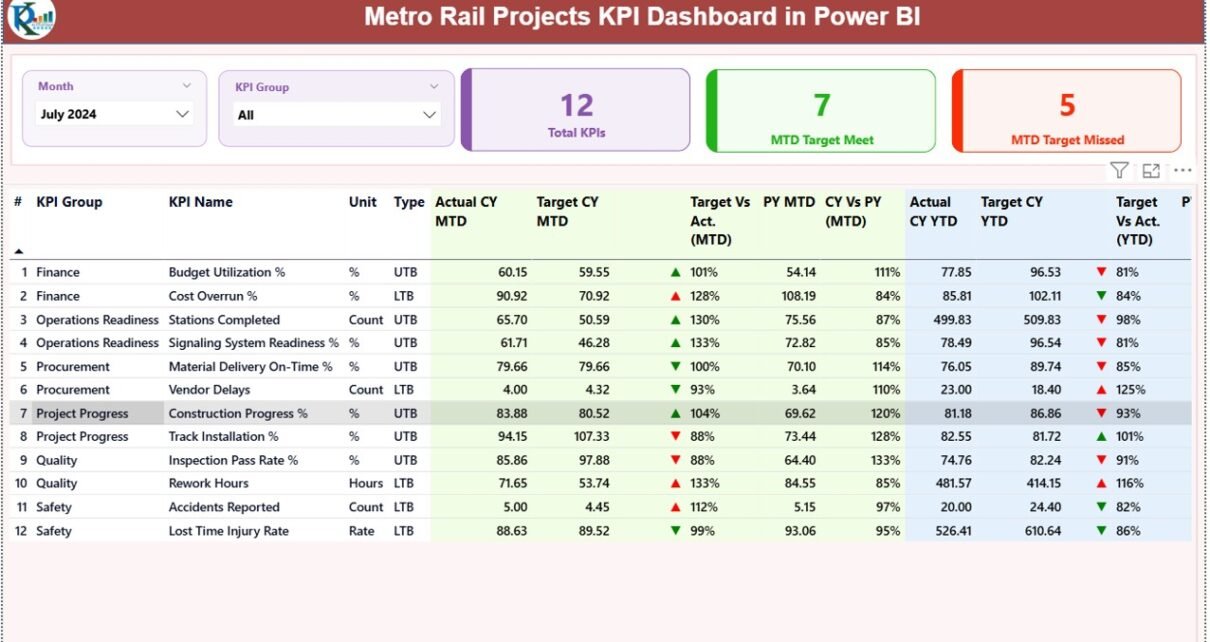
Metro Rail Projects KPI Dashboard in Power BI

December 23, 2025December 23, 2025 PKComments Off on Metro Rail Projects KPI Dashboard in Power BI
Metro rail projects involve massive investments, tight timelines, public accountability, and strict performance expectations. Therefore, project authorities must track progress, cost, quality, and efficiency continuously. However, when data stays scattered
Read More
Dashboard

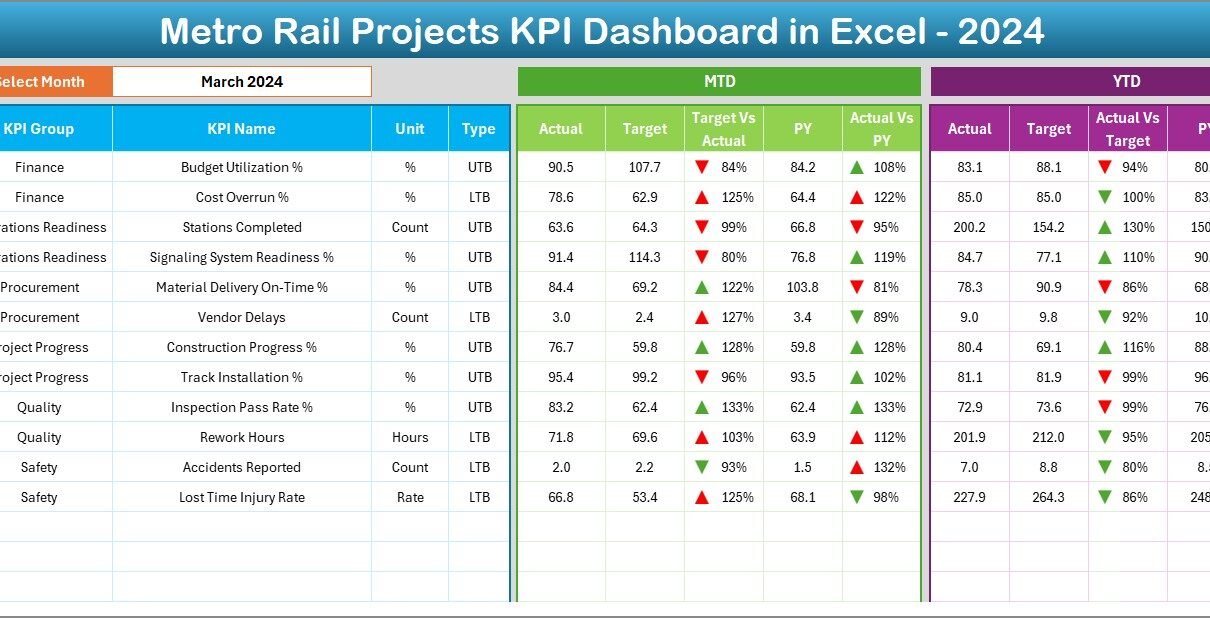
Metro Rail Projects KPI Dashboard in Excel

December 12, 2025December 12, 2025 PKComments Off on Metro Rail Projects KPI Dashboard in Excel
Metro rail networks grow every year as cities expand and demand for public transportation rises. Because of this rapid growth, project teams must monitor dozens of KPIs every month. When
Read More
  • Learn Excel (Free Course)
    • 1. Shortcut Keys
    • 2. Fill & Flash Fill
    • 3. Find & Replace
    • 4. Sort & Filter
    • 5. Formulas & Functions
    • 6. Data Validation
    • 7. Conditional Formatting
    • 8. Basic Charts
    • 9. Advanced Charts
    • 10. Pivot Tables
    • 11. Excel Dashboards
    • 12. VBA Course
    • 13. Excel Formulas with AI
  • Templates
  • Tutorials
    • Charts and Visualization
    • VBA
    • Excel Tips and Tricks
    • Excel Dashboards
    • Power Pivot & DAX
  • Power BI
  • Template Store
    • Ready to Use Templates
  • Courses
  • Academy
    • Excel + AI Mastery: 100 Formulas
    • Excel Pivot Tables & Dashboards
  • About Us
  • Contact Us
Copyright © 2023 PK-AnExcelExpert.com - Privacy Policy