New: NextGenTemplates Academy - video courses on Excel formulas with AI and Pivot Tables & dashboards. Early-bird: 20% off with code EARLYBIRD20 - first 20 orders only.See the courses →
PKComments Off on Carpooling Platforms Dashboard in Power BI
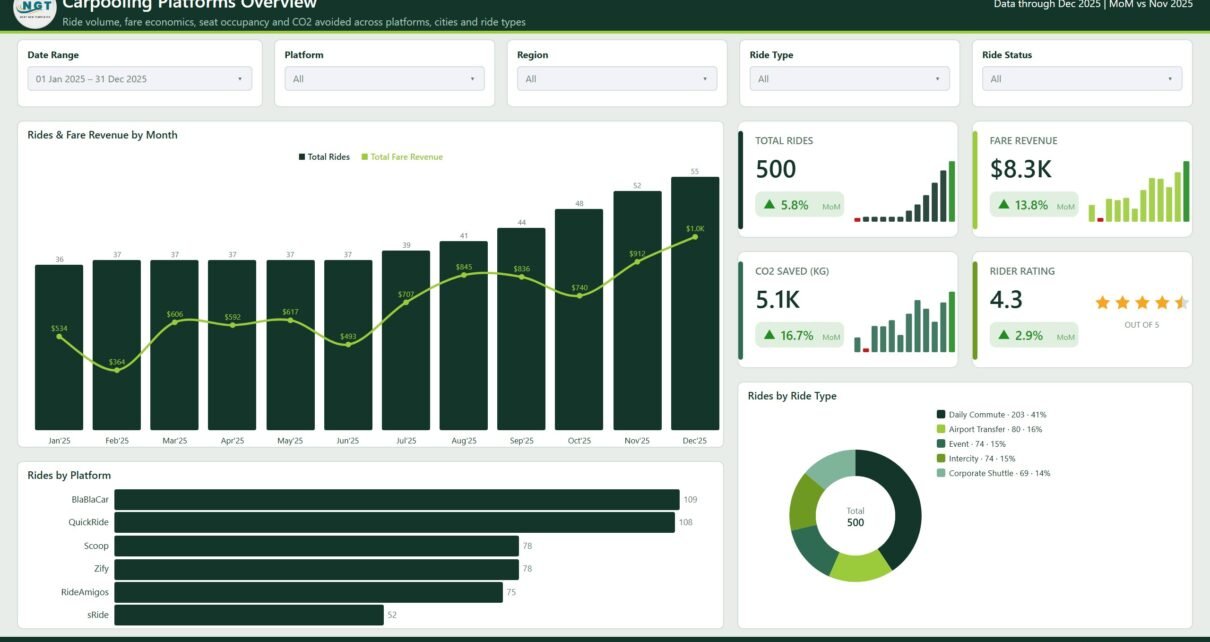
Most carpooling operators can tell you how many rides they ran last month. Far fewer can tell you, in the same breath, what share of the offered seats were actually
PKComments Off on Carpooling Platforms Dashboard in Excel
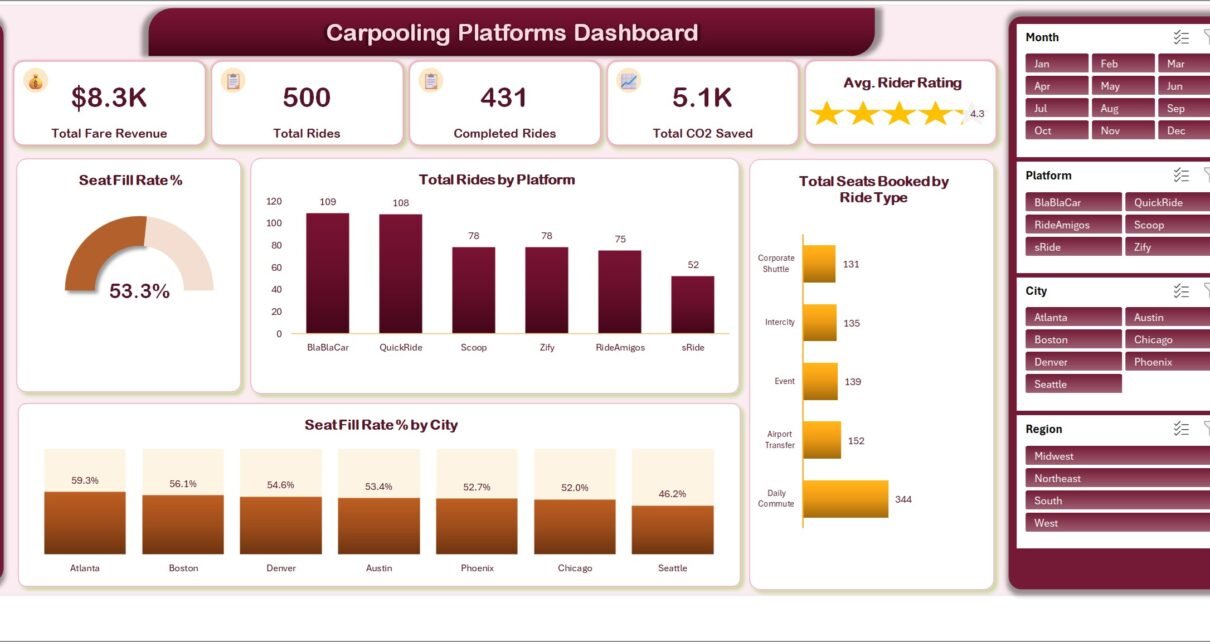
Carpooling operators sit on a lot of ride data and very little reporting. Every completed trip produces a fare, a driver payout, a seat count, a distance and a carbon
PKComments Off on Micro-Mobility Platforms Dashboard in Power BI
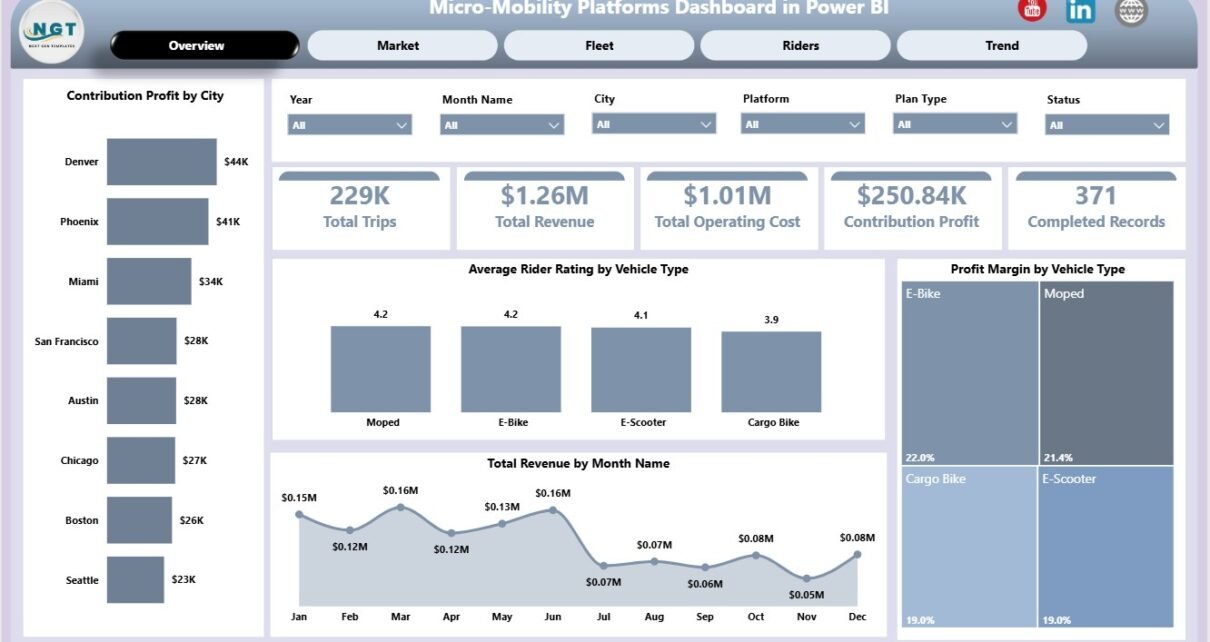
The Micro-Mobility Platforms Dashboard in Power BI helps shared scooter, bike-share, e-bike, and urban mobility teams review operations across 5 report pages, 5 executive KPI cards, and 18 focused chart
PKComments Off on Micro-Mobility Platforms Dashboard in Excel
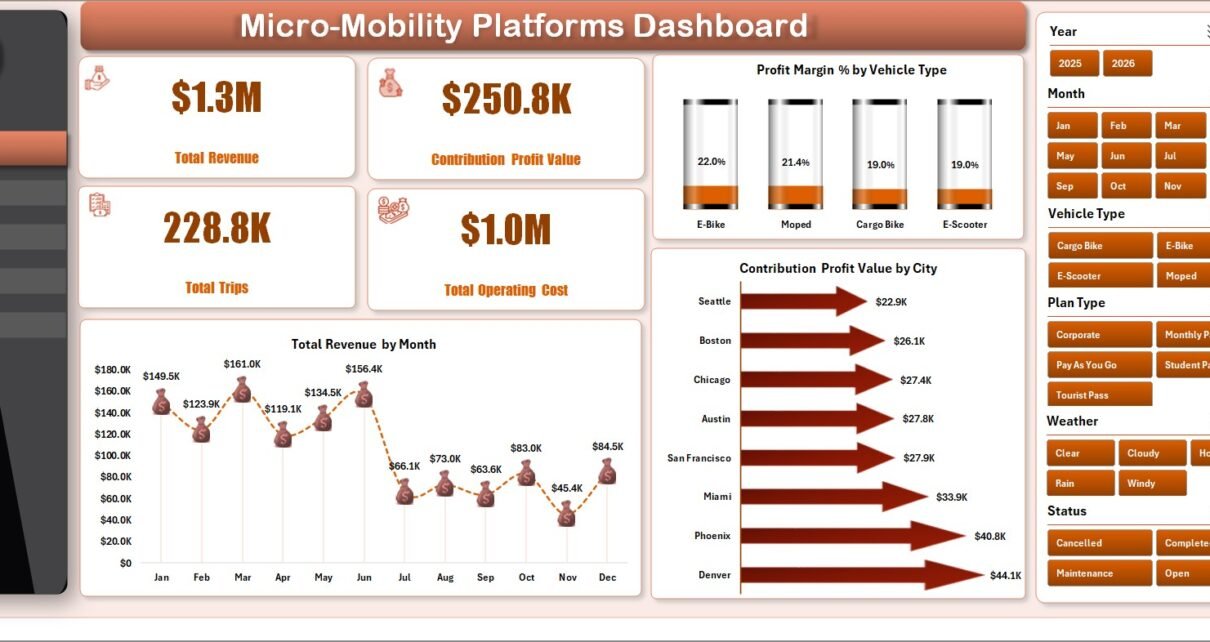
The Micro-Mobility Platforms Dashboard in Excel helps shared scooter, bike-share, e-bike, and urban mobility teams turn trip, rider, fleet, market, and cost records into clear performance reporting. The workbook includes
PKComments Off on Autonomous Vehicles KPI Dashboard in Power BI
Autonomous vehicles are no longer a futuristic idea. Instead, they already operate on roads, in testing zones, and within logistics networks. However, autonomy without measurement leads to uncertainty. Therefore, organizations
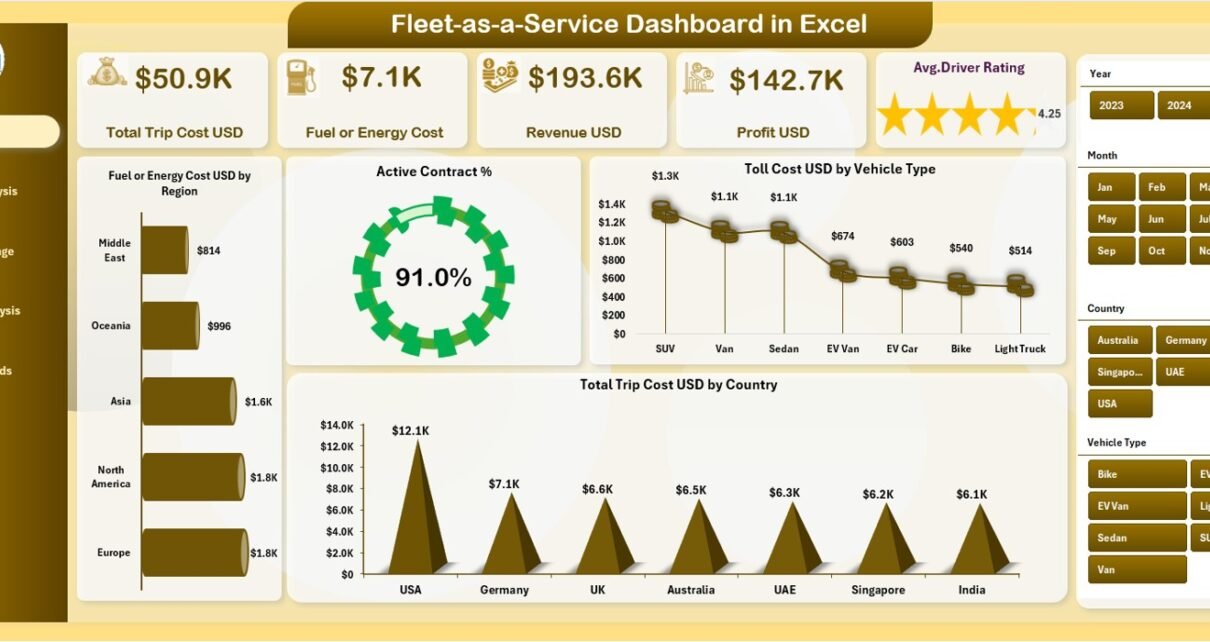
PKComments Off on Fleet-as-a-Service Dashboard in Excel
Fleet-as-a-Service (FaaS) has transformed how organizations manage transportation, mobility, and logistics. Instead of owning and maintaining large fleets, companies now focus on service-oriented fleet usage, performance, and profitability. However, without
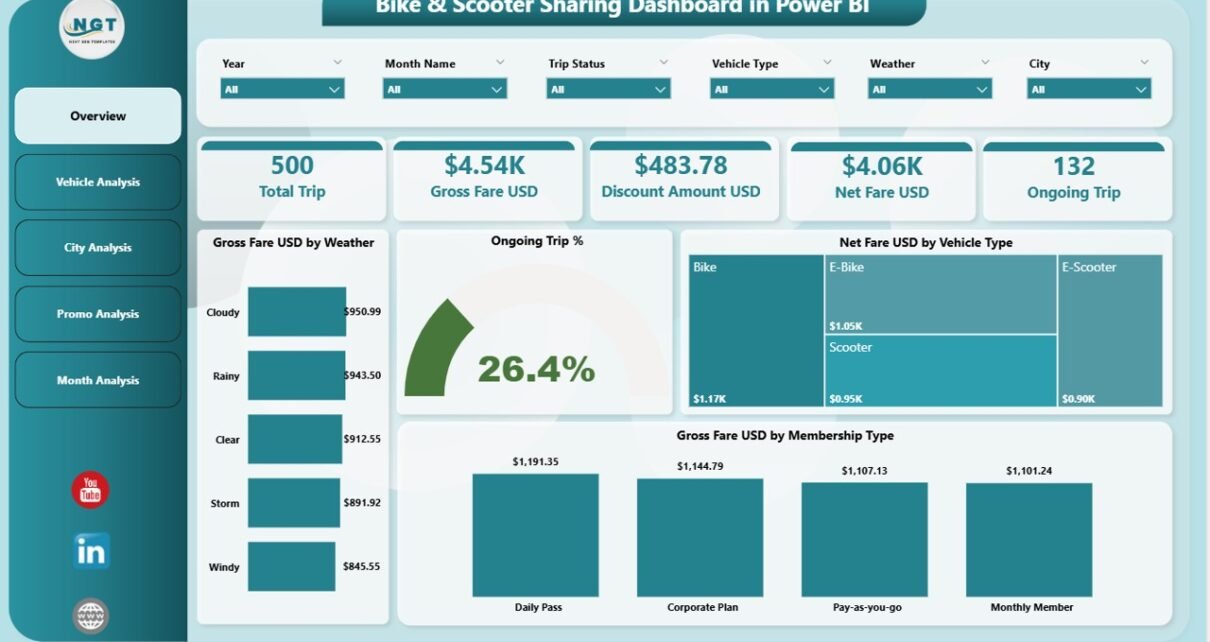
PKComments Off on Bike & Scooter Sharing Dashboard in Power BI
Urban mobility changes rapidly, and bike and scooter sharing systems continue to grow across major cities. Operators handle huge volumes of trip data every hour—weather conditions, membership types, trip durations,
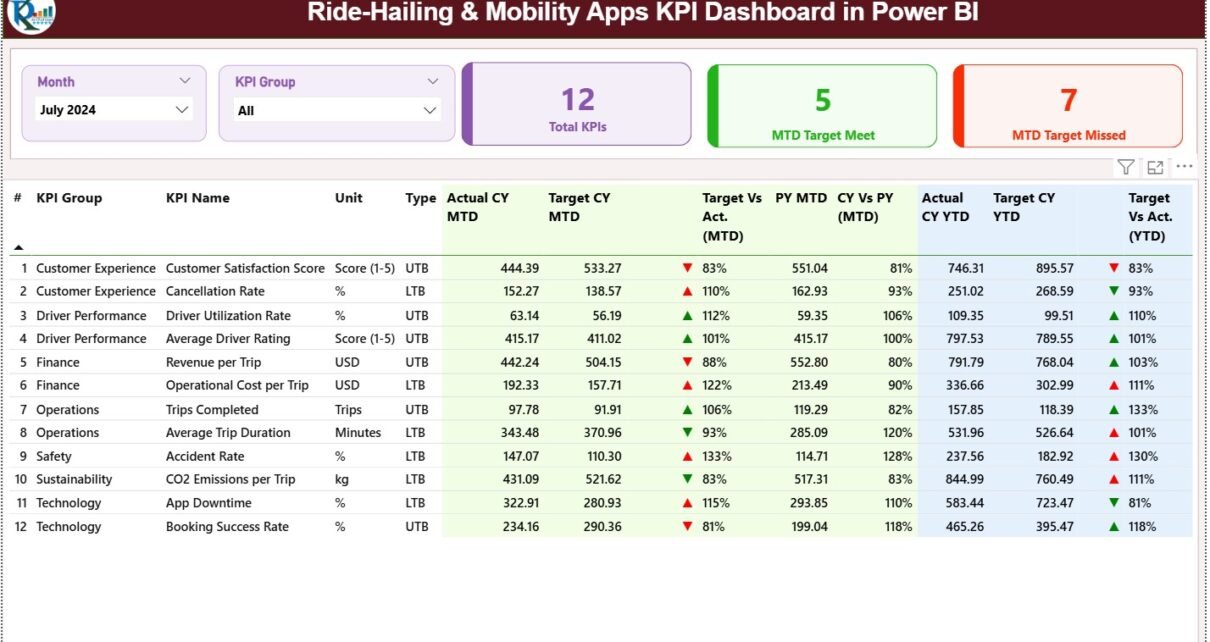
PKComments Off on Ride-Hailing & Mobility Apps KPI Dashboard in Power BI
The ride-hailing and mobility services industry grows quickly because more customers prefer app-based bookings for taxis, autos, bikes, and shared rides. As the business expands, companies need fast, accurate, and