New: NextGenTemplates Academy - video courses on Excel formulas with AI and Pivot Tables & dashboards. Early-bird: 20% off with code EARLYBIRD20 - first 20 orders only. See the courses →
  • Learn Excel (Free Course)
    • 1. Shortcut Keys
    • 2. Fill & Flash Fill
    • 3. Find & Replace
    • 4. Sort & Filter
    • 5. Formulas & Functions
    • 6. Data Validation
    • 7. Conditional Formatting
    • 8. Basic Charts
    • 9. Advanced Charts
    • 10. Pivot Tables
    • 11. Excel Dashboards
    • 12. VBA Course
    • 13. Excel Formulas with AI
  • Templates
  • Tutorials
    • Charts and Visualization
    • VBA
    • Excel Tips and Tricks
    • Excel Dashboards
    • Power Pivot & DAX
  • Power BI
  • Template Store
    • Ready to Use Templates
  • Courses
  • Academy
    • Excel + AI Mastery: 100 Formulas
    • Excel Pivot Tables & Dashboards
  • About Us
  • Contact Us

PK: An Excel Expert

Transforming Data into Decisions

Tag: Monthly KPI Dashboard

Dashboard Power BI

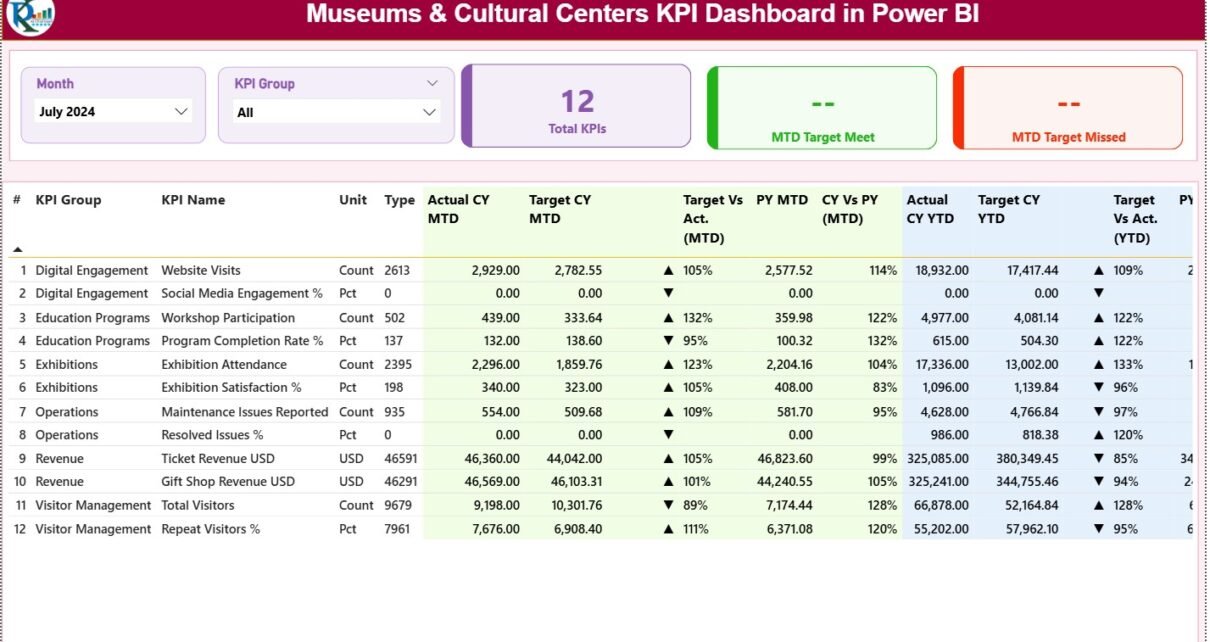
Museums & Cultural Centres KPI Dashboard in Power BI

December 12, 2025December 12, 2025 PKComments Off on Museums & Cultural Centres KPI Dashboard in Power BI
Museums and cultural centres play an important role in preserving history, promoting creativity, and enriching communities. Because of this heavy responsibility, cultural institutions must track many performance metrics to understand
Read More
Templates

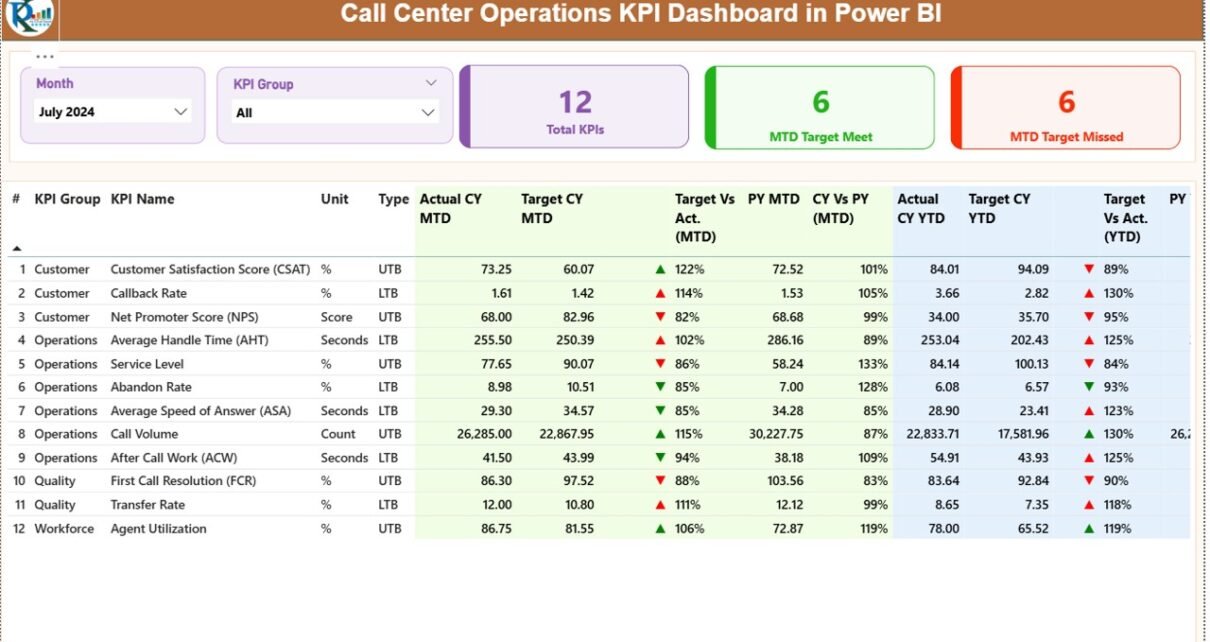
Call Center Operations KPI Dashboard in Power BI

December 1, 2025December 1, 2025 PKComments Off on Call Center Operations KPI Dashboard in Power BI
Managing a call center demands constant monitoring, fast decisions, and instant access to accurate performance data. Call volumes change every hour, customers expect quick resolutions, and managers need a real-time
Read More
Templates

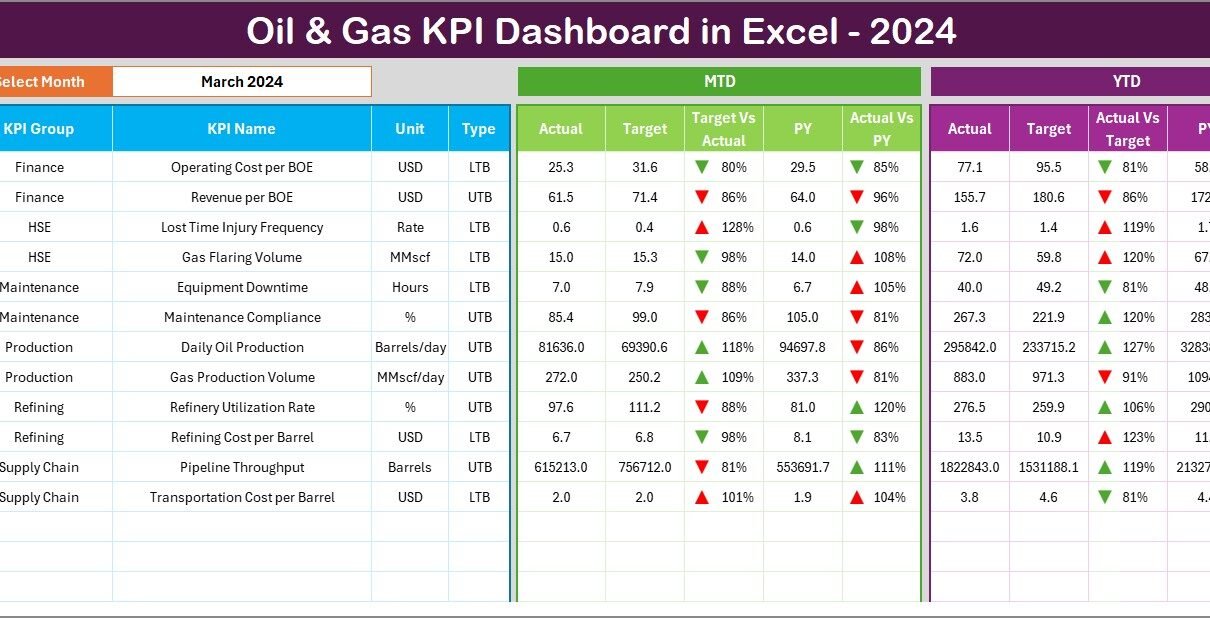
Oil & Gas KPI Dashboard in Excel

November 17, 2025November 17, 2025 PKComments Off on Oil & Gas KPI Dashboard in Excel
Oil and gas companies work in one of the most dynamic, fast-moving, and high-risk industries in the world. Daily operations shift quickly, exploration costs keep changing, production volumes rise and
Read More
Dashboard

Accounting Firms Dashboard in Excel

November 14, 2025November 14, 2025 PKComments Off on Accounting Firms Dashboard in Excel
Accounting firms handle huge volumes of financial data every single day. Teams monitor revenue, expenses, client satisfaction, service performance, engagements, and monthly profitability. Because so many things happen at once,
Read More
  • Learn Excel (Free Course)
    • 1. Shortcut Keys
    • 2. Fill & Flash Fill
    • 3. Find & Replace
    • 4. Sort & Filter
    • 5. Formulas & Functions
    • 6. Data Validation
    • 7. Conditional Formatting
    • 8. Basic Charts
    • 9. Advanced Charts
    • 10. Pivot Tables
    • 11. Excel Dashboards
    • 12. VBA Course
    • 13. Excel Formulas with AI
  • Templates
  • Tutorials
    • Charts and Visualization
    • VBA
    • Excel Tips and Tricks
    • Excel Dashboards
    • Power Pivot & DAX
  • Power BI
  • Template Store
    • Ready to Use Templates
  • Courses
  • Academy
    • Excel + AI Mastery: 100 Formulas
    • Excel Pivot Tables & Dashboards
  • About Us
  • Contact Us
Copyright © 2023 PK-AnExcelExpert.com - Privacy Policy