New: NextGenTemplates Academy - video courses on Excel formulas with AI and Pivot Tables & dashboards. Early-bird: 20% off with code EARLYBIRD20 - first 20 orders only. See the courses →
  • Learn Excel (Free Course)
    • 1. Shortcut Keys
    • 2. Fill & Flash Fill
    • 3. Find & Replace
    • 4. Sort & Filter
    • 5. Formulas & Functions
    • 6. Data Validation
    • 7. Conditional Formatting
    • 8. Basic Charts
    • 9. Advanced Charts
    • 10. Pivot Tables
    • 11. Excel Dashboards
    • 12. VBA Course
    • 13. Excel Formulas with AI
  • Templates
  • Tutorials
    • Charts and Visualization
    • VBA
    • Excel Tips and Tricks
    • Excel Dashboards
    • Power Pivot & DAX
  • Power BI
  • Template Store
    • Ready to Use Templates
  • Courses
  • Academy
    • Excel + AI Mastery: 100 Formulas
    • Excel Pivot Tables & Dashboards
  • About Us
  • Contact Us

PK: An Excel Expert

Transforming Data into Decisions

Tag: Monthly Trend Analysis

Dashboard

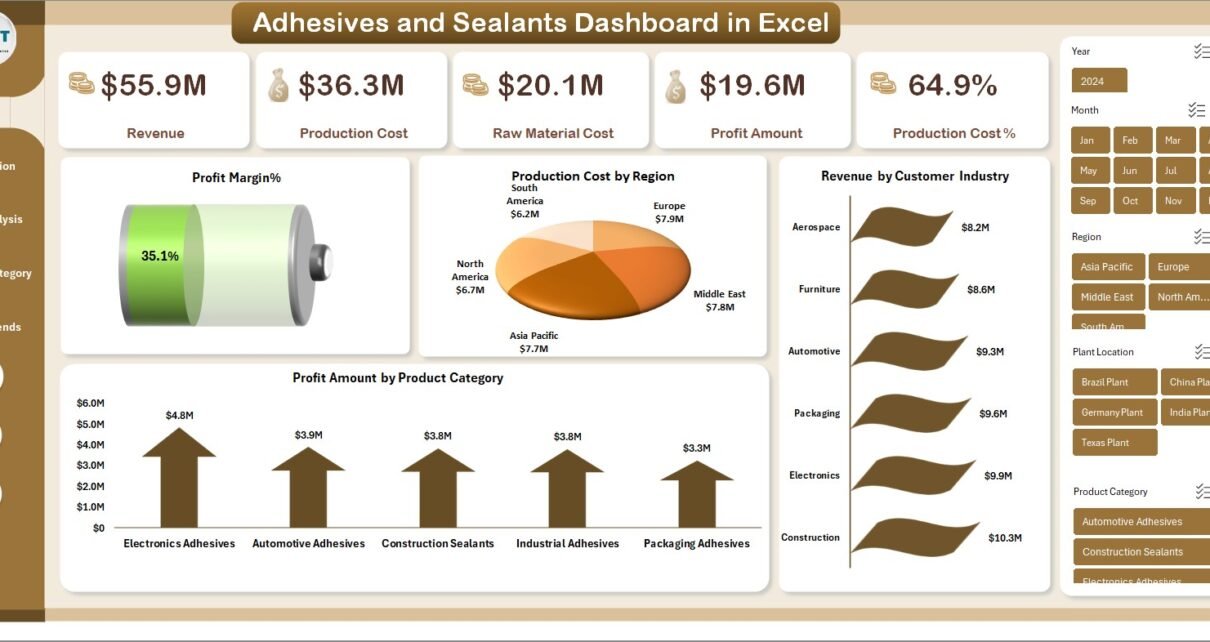
Adhesives and Sealants Dashboard in Excel

March 9, 2026March 9, 2026 PKComments Off on Adhesives and Sealants Dashboard in Excel
The adhesives and sealants industry plays a critical role in modern manufacturing. From automotive and construction to electronics and packaging, almost every industry uses adhesives and sealants in production processes.
Read More
Dashboard

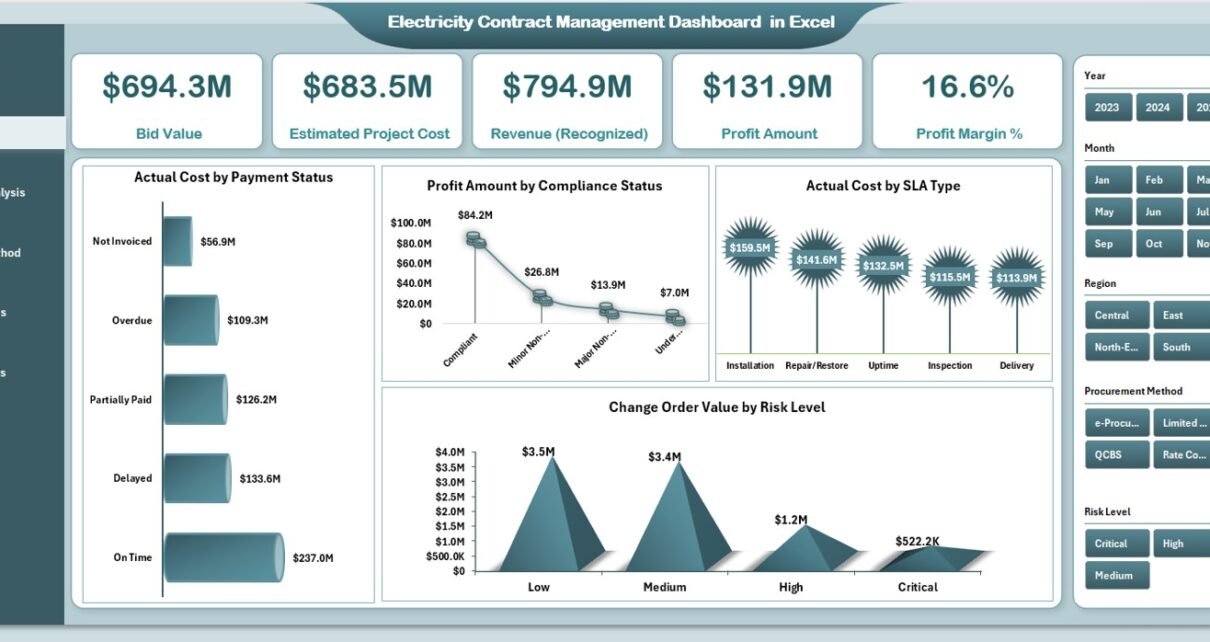
Electricity Contract Management Dashboard in Excel

December 23, 2025December 23, 2025 PKComments Off on Electricity Contract Management Dashboard in Excel
An Electricity Contract Management Dashboard in Excel is a structured, interactive, and ready-to-use reporting solution that helps organizations manage electricity-related contracts efficiently. These contracts may include power purchase agreements, transmission
Read More
Dashboard Power BI

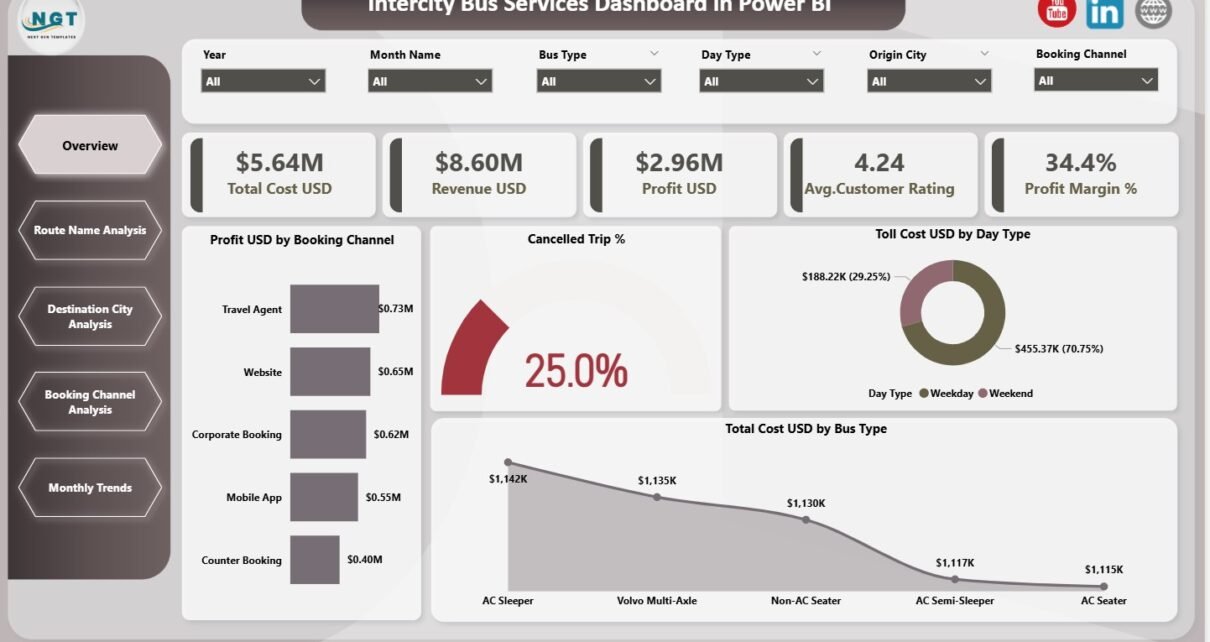
Intercity Bus Services Dashboard in Power BI

December 18, 2025December 18, 2025 PKComments Off on Intercity Bus Services Dashboard in Power BI
Intercity bus services operate in a highly competitive and cost-sensitive environment. Operators must manage fuel expenses, toll costs, route profitability, customer satisfaction, and booking channels while maintaining service reliability. However,
Read More
Dashboard

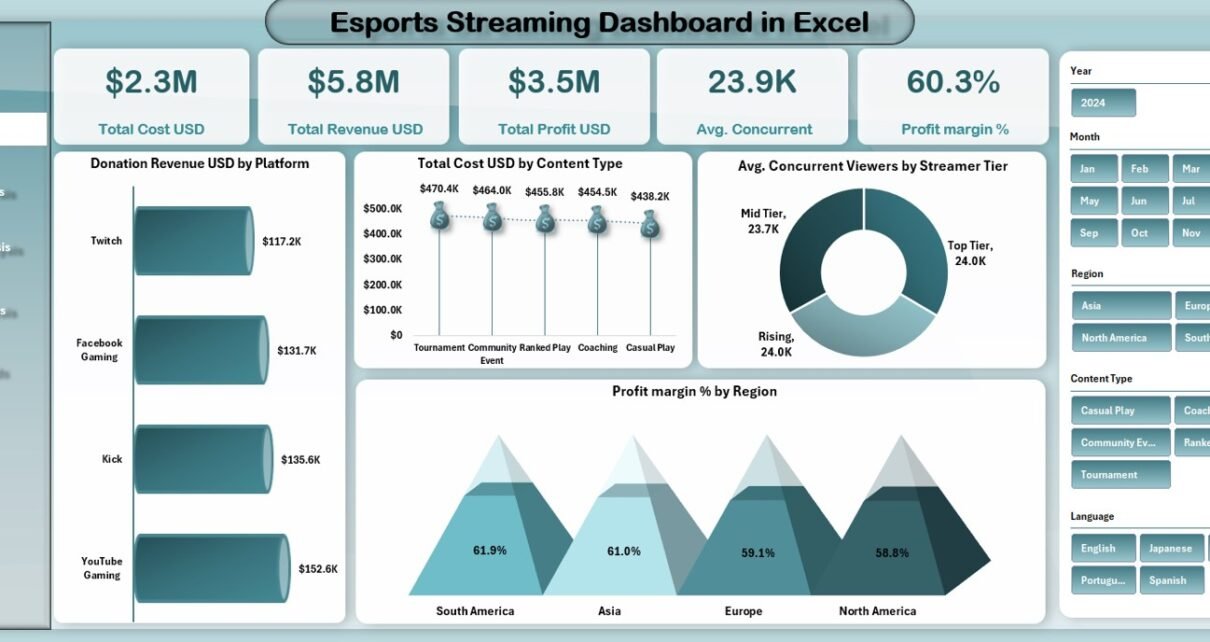
Esports Streaming Dashboard in Excel

December 18, 2025December 18, 2025 PKComments Off on Esports Streaming Dashboard in Excel
The esports streaming industry continues to grow at a rapid pace. Platforms such as Twitch, YouTube Gaming, and Facebook Gaming generate massive volumes of data every day. Streamers, esports organizations,
Read More
  • Learn Excel (Free Course)
    • 1. Shortcut Keys
    • 2. Fill & Flash Fill
    • 3. Find & Replace
    • 4. Sort & Filter
    • 5. Formulas & Functions
    • 6. Data Validation
    • 7. Conditional Formatting
    • 8. Basic Charts
    • 9. Advanced Charts
    • 10. Pivot Tables
    • 11. Excel Dashboards
    • 12. VBA Course
    • 13. Excel Formulas with AI
  • Templates
  • Tutorials
    • Charts and Visualization
    • VBA
    • Excel Tips and Tricks
    • Excel Dashboards
    • Power Pivot & DAX
  • Power BI
  • Template Store
    • Ready to Use Templates
  • Courses
  • Academy
    • Excel + AI Mastery: 100 Formulas
    • Excel Pivot Tables & Dashboards
  • About Us
  • Contact Us
Copyright © 2023 PK-AnExcelExpert.com - Privacy Policy