New: NextGenTemplates Academy - video courses on Excel formulas with AI and Pivot Tables & dashboards. Early-bird: 20% off with code EARLYBIRD20 - first 20 orders only. See the courses →
  • Learn Excel (Free Course)
    • 1. Shortcut Keys
    • 2. Fill & Flash Fill
    • 3. Find & Replace
    • 4. Sort & Filter
    • 5. Formulas & Functions
    • 6. Data Validation
    • 7. Conditional Formatting
    • 8. Basic Charts
    • 9. Advanced Charts
    • 10. Pivot Tables
    • 11. Excel Dashboards
    • 12. VBA Course
    • 13. Excel Formulas with AI
  • Templates
  • Tutorials
    • Charts and Visualization
    • VBA
    • Excel Tips and Tricks
    • Excel Dashboards
    • Power Pivot & DAX
  • Power BI
  • Template Store
    • Ready to Use Templates
  • Courses
  • Academy
    • Excel + AI Mastery: 100 Formulas
    • Excel Pivot Tables & Dashboards
  • About Us
  • Contact Us

PK: An Excel Expert

Transforming Data into Decisions

Tag: monthly trends dashboard

Dashboard

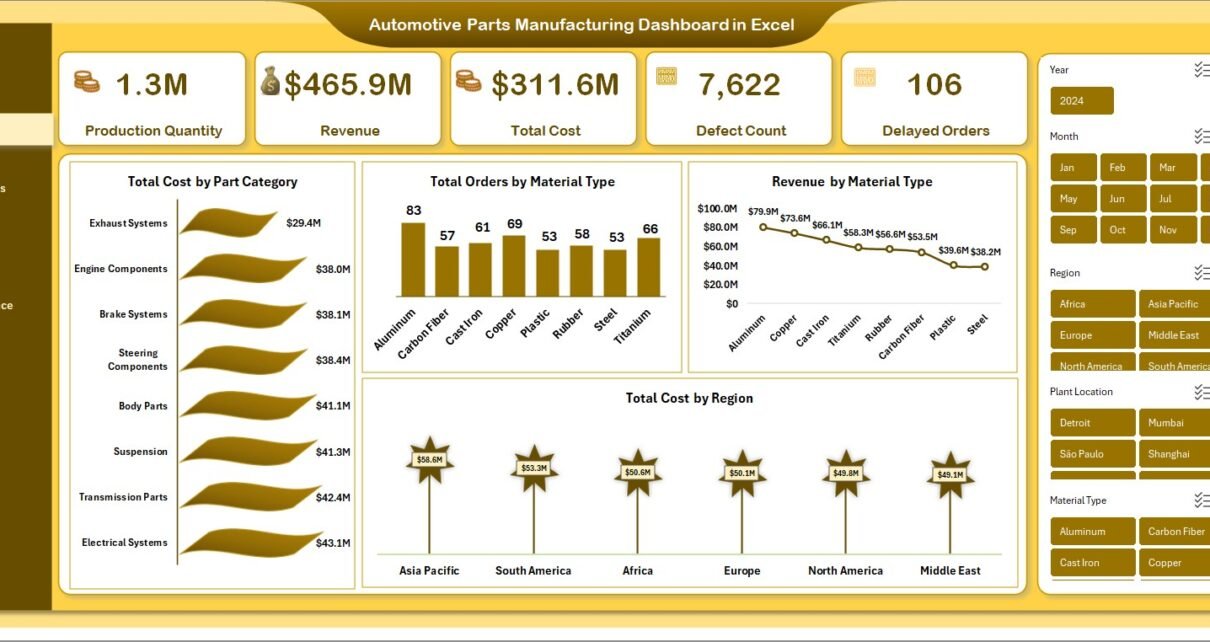
Automotive Parts Manufacturing Dashboard in Excel

March 19, 2026March 20, 2026 PKComments Off on Automotive Parts Manufacturing Dashboard in Excel
In today’s competitive manufacturing world, automotive parts companies handle huge amounts of data every day. They track production quantity, revenue, material usage, costs, defects, delayed orders, safety incidents, and monthly
Read More
Dashboard Power BI

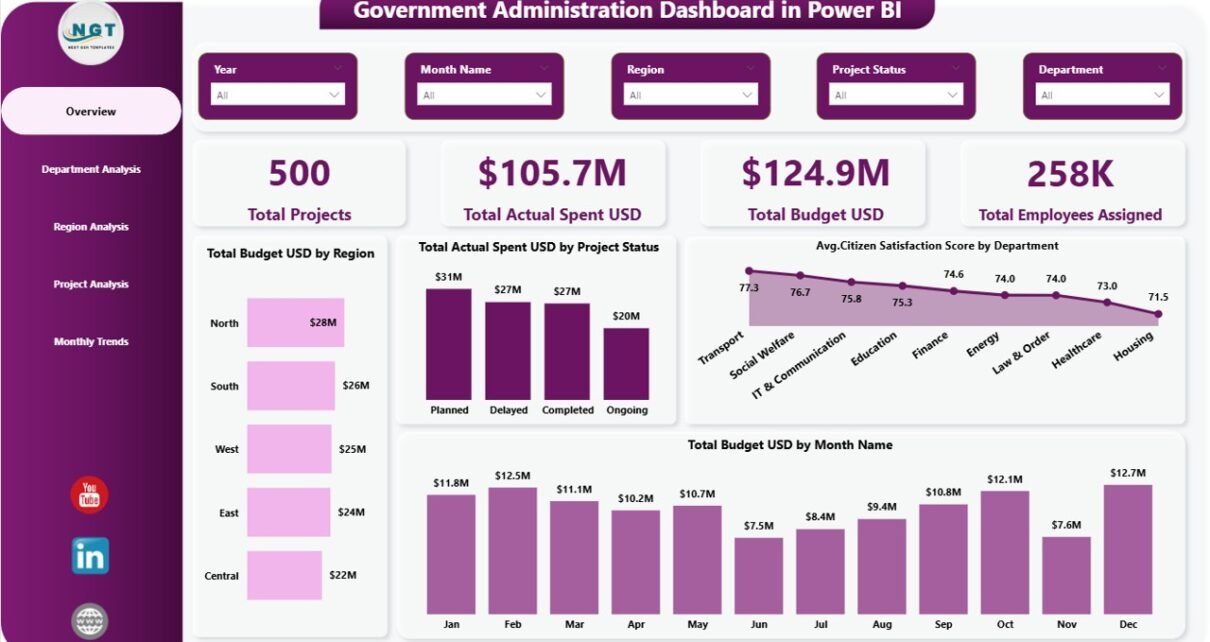
Government Administration Dashboard in Power BI

February 25, 2026February 25, 2026 PKComments Off on Government Administration Dashboard in Power BI
Government organizations manage hundreds of projects, departments, budgets, and public services every year. However, decision-makers often struggle because data remains scattered across spreadsheets, reports, and manual systems. As a result,
Read More
Dashboard Power BI

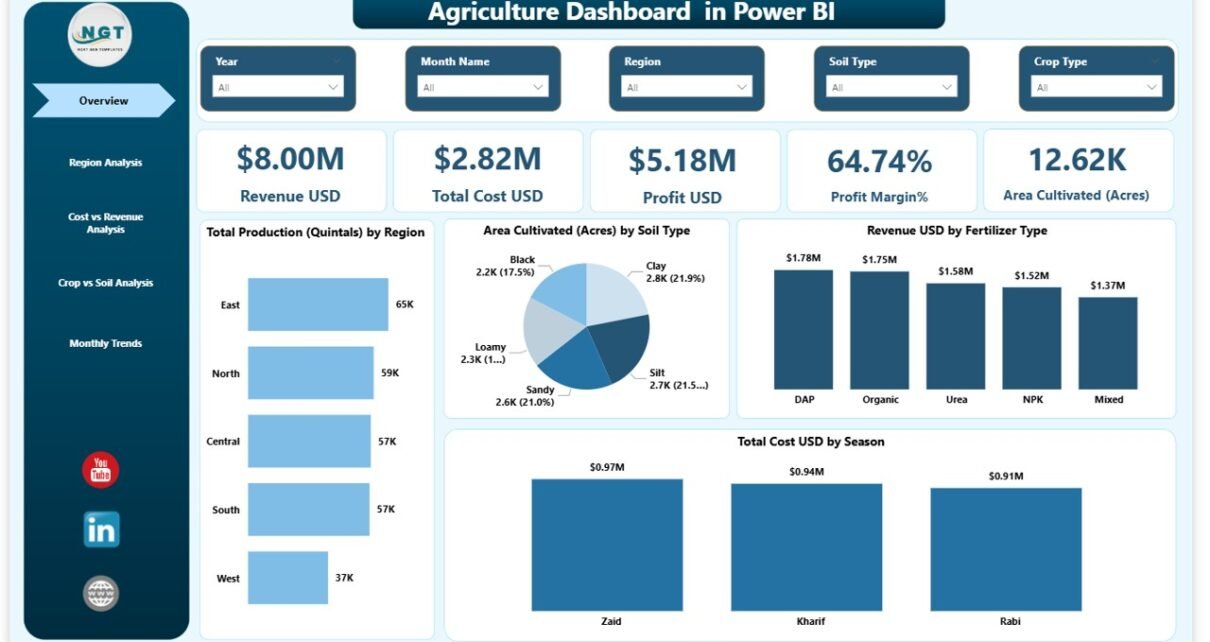
Agriculture Dashboard in Power BI

February 14, 2026February 14, 2026 PKComments Off on Agriculture Dashboard in Power BI
Agriculture drives economies, supports livelihoods, and feeds millions every day. However, farmers, agribusiness owners, and agriculture consultants often struggle with scattered spreadsheets and delayed reports. As a result, they lose
Read More
Dashboard Power BI

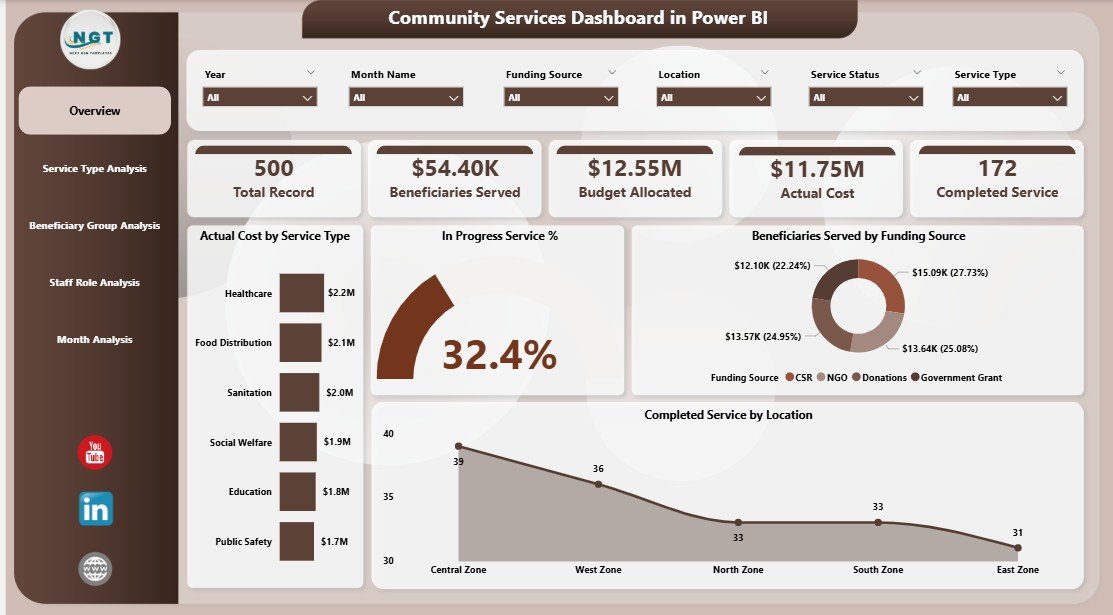
Community Services Dashboard in Power BI

January 13, 2026January 13, 2026 PKComments Off on Community Services Dashboard in Power BI
Managing community services without clear visibility often leads to confusion, delays, and missed impact. However, when organizations use a Community Services Dashboard in Power BI, they gain clarity, control, and
Read More
Dashboard Power BI

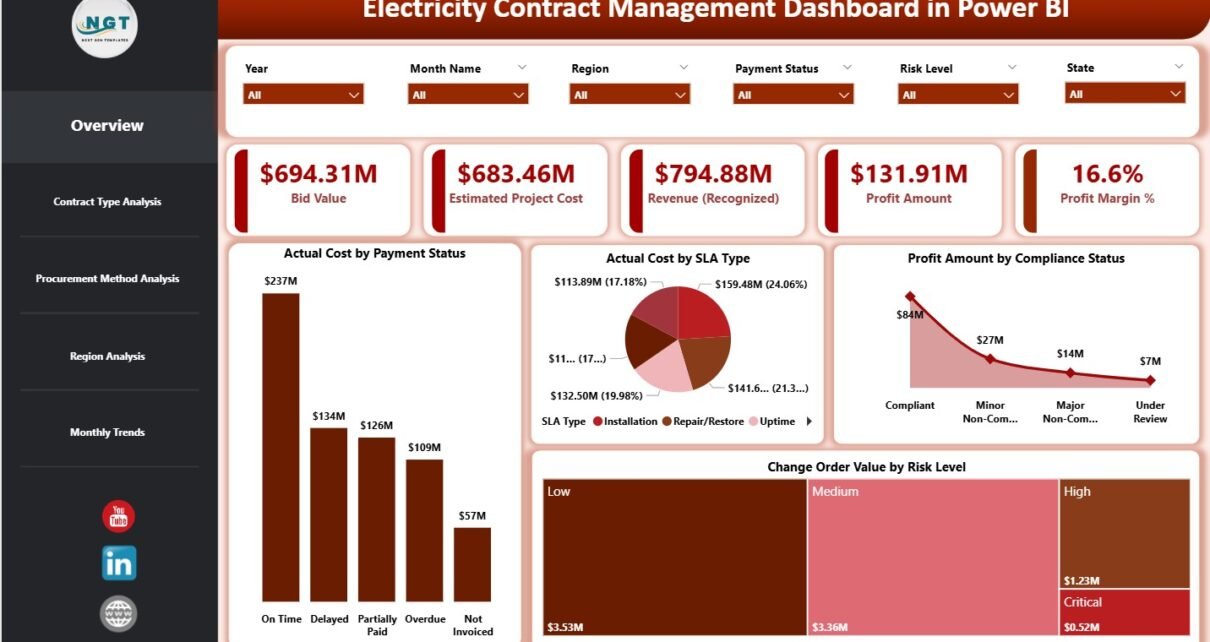
Electricity Contract Management Dashboard in Power BI

December 24, 2025December 24, 2025 PKComments Off on Electricity Contract Management Dashboard in Power BI
Managing electricity contracts is never simple. Organizations must track bid values, estimated project costs, revenues, profits, risks, compliance, and timelines at the same time. However, when contract data stays scattered
Read More
Dashboard Power BI

Research & Development Institutes Dashboard in Power BI

December 22, 2025December 22, 2025 PKComments Off on Research & Development Institutes Dashboard in Power BI
Research and Development (R&D) institutes drive innovation, scientific discovery, and long-term growth. However, without clear performance visibility, even the best research initiatives lose direction. Therefore, leaders must track projects, budgets,
Read More
Dashboard

Port Logistics Dashboard in Excel

December 6, 2025December 6, 2025 PKComments Off on Port Logistics Dashboard in Excel
Port logistics plays a critical role in global trade and supply chains. Every day, ports handle thousands of containers, vessels, cargo types, shipping lines, and terminals. However, managing cost, revenue,
Read More
Dashboard Power BI

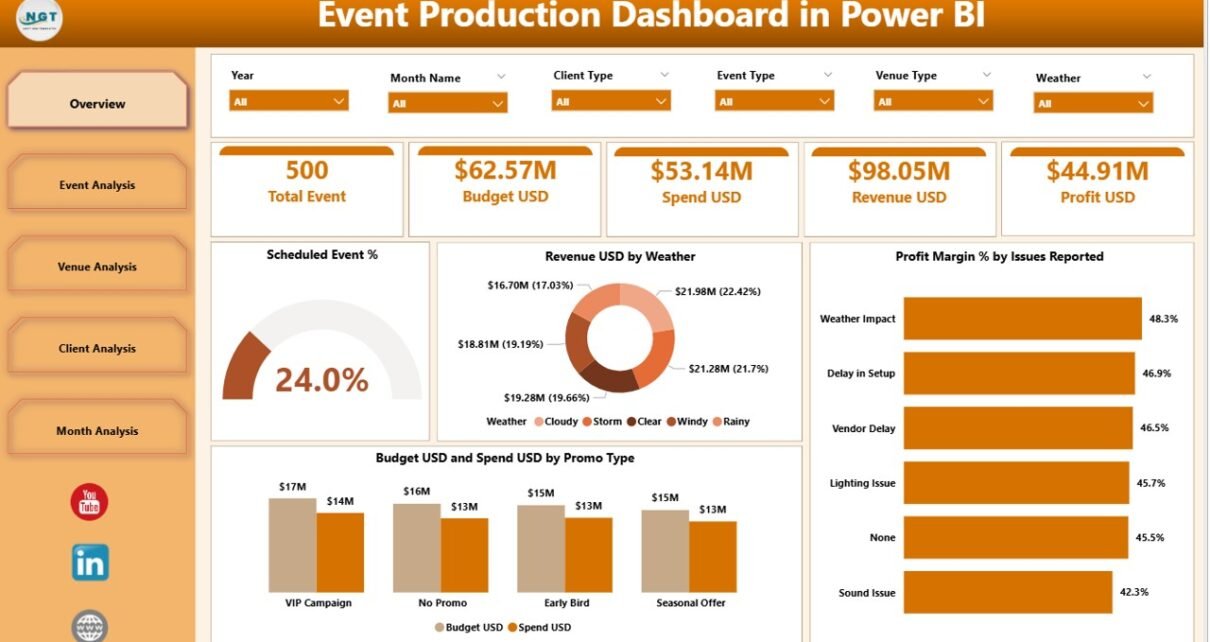
Event Production Dashboard in Power BI

December 5, 2025December 5, 2025 PKComments Off on Event Production Dashboard in Power BI
Event production teams handle many responsibilities at the same time. They plan events, coordinate venues, manage budgets, track execution challenges, and ensure client satisfaction. However, scattered spreadsheets and manual reports
Read More
Dashboard Power BI

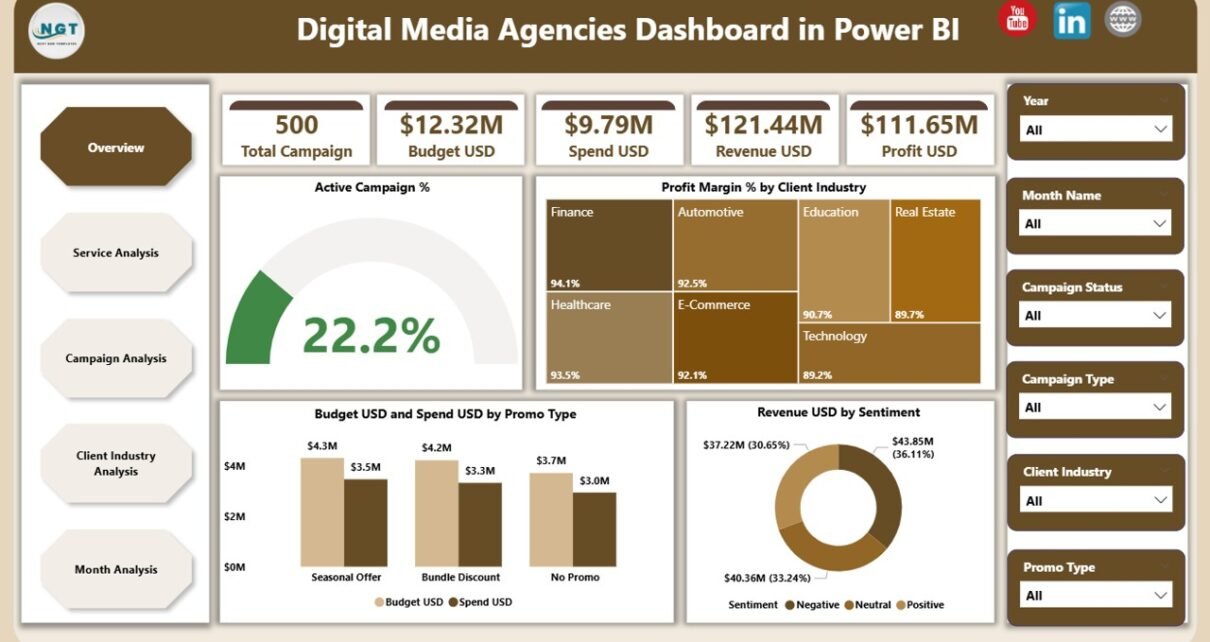
Digital Media Agencies Dashboard in Power BI

December 4, 2025December 4, 2025 PKComments Off on Digital Media Agencies Dashboard in Power BI
Digital media agencies handle hundreds of tasks every day—from planning ad campaigns to tracking budgets, monitoring client performance, managing service-wise profits, and analyzing monthly trends. Because of this wide workload,
Read More
Templates

Office Waste Management Dashboard in Excel

December 3, 2025December 3, 2025 PKComments Off on Office Waste Management Dashboard in Excel
Managing office waste becomes challenging when multiple departments, vendors, and waste categories generate different types of waste every day. Teams struggle when they track everything manually because sheets grow large,
Read More

Posts pagination

1 2 3 Next
  • Learn Excel (Free Course)
    • 1. Shortcut Keys
    • 2. Fill & Flash Fill
    • 3. Find & Replace
    • 4. Sort & Filter
    • 5. Formulas & Functions
    • 6. Data Validation
    • 7. Conditional Formatting
    • 8. Basic Charts
    • 9. Advanced Charts
    • 10. Pivot Tables
    • 11. Excel Dashboards
    • 12. VBA Course
    • 13. Excel Formulas with AI
  • Templates
  • Tutorials
    • Charts and Visualization
    • VBA
    • Excel Tips and Tricks
    • Excel Dashboards
    • Power Pivot & DAX
  • Power BI
  • Template Store
    • Ready to Use Templates
  • Courses
  • Academy
    • Excel + AI Mastery: 100 Formulas
    • Excel Pivot Tables & Dashboards
  • About Us
  • Contact Us
Copyright © 2023 PK-AnExcelExpert.com - Privacy Policy