New: NextGenTemplates Academy - video courses on Excel formulas with AI and Pivot Tables & dashboards. Early-bird: 20% off with code EARLYBIRD20 - first 20 orders only. See the courses →
  • Learn Excel (Free Course)
    • 1. Shortcut Keys
    • 2. Fill & Flash Fill
    • 3. Find & Replace
    • 4. Sort & Filter
    • 5. Formulas & Functions
    • 6. Data Validation
    • 7. Conditional Formatting
    • 8. Basic Charts
    • 9. Advanced Charts
    • 10. Pivot Tables
    • 11. Excel Dashboards
    • 12. VBA Course
    • 13. Excel Formulas with AI
  • Templates
  • Tutorials
    • Charts and Visualization
    • VBA
    • Excel Tips and Tricks
    • Excel Dashboards
    • Power Pivot & DAX
  • Power BI
  • Template Store
    • Ready to Use Templates
  • Courses
  • Academy
    • Excel + AI Mastery: 100 Formulas
    • Excel Pivot Tables & Dashboards
  • About Us
  • Contact Us

PK: An Excel Expert

Transforming Data into Decisions

Tag: MTD analysis

Dashboard Power BI

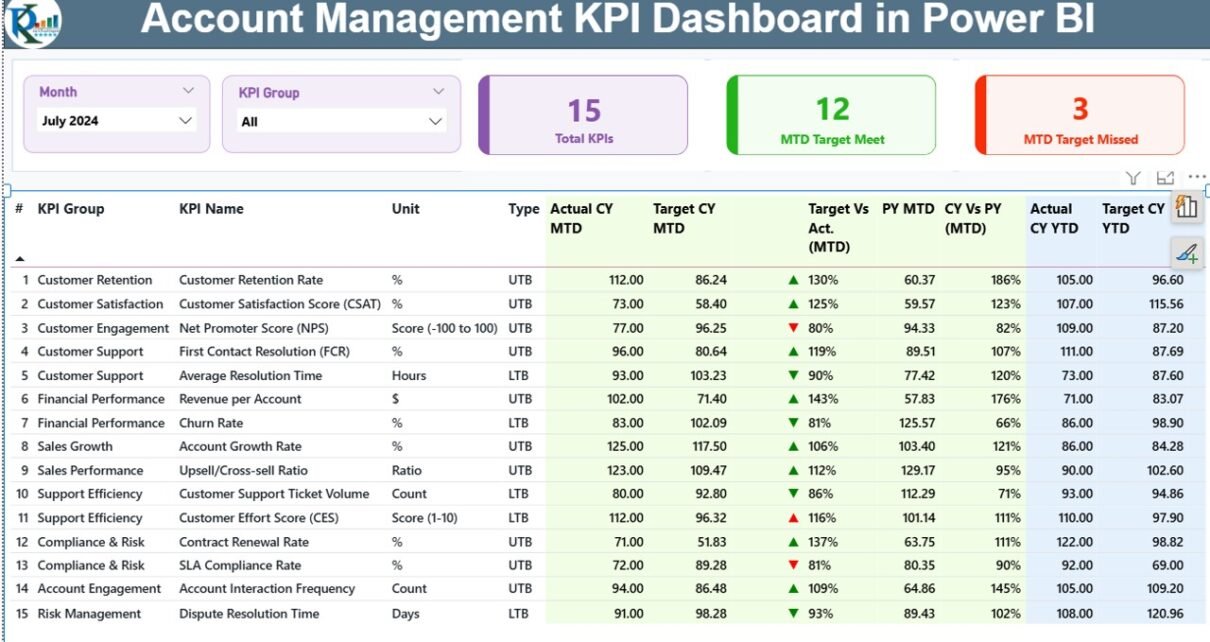
Account Management KPI Dashboard in Power BI

November 28, 2025November 28, 2025 PKComments Off on Account Management KPI Dashboard in Power BI
Monitoring account performance becomes difficult when data lives in multiple files, scattered reports, or outdated summaries. Even small account management teams handle many KPIs every month, and this often leads
Read More
Dashboard

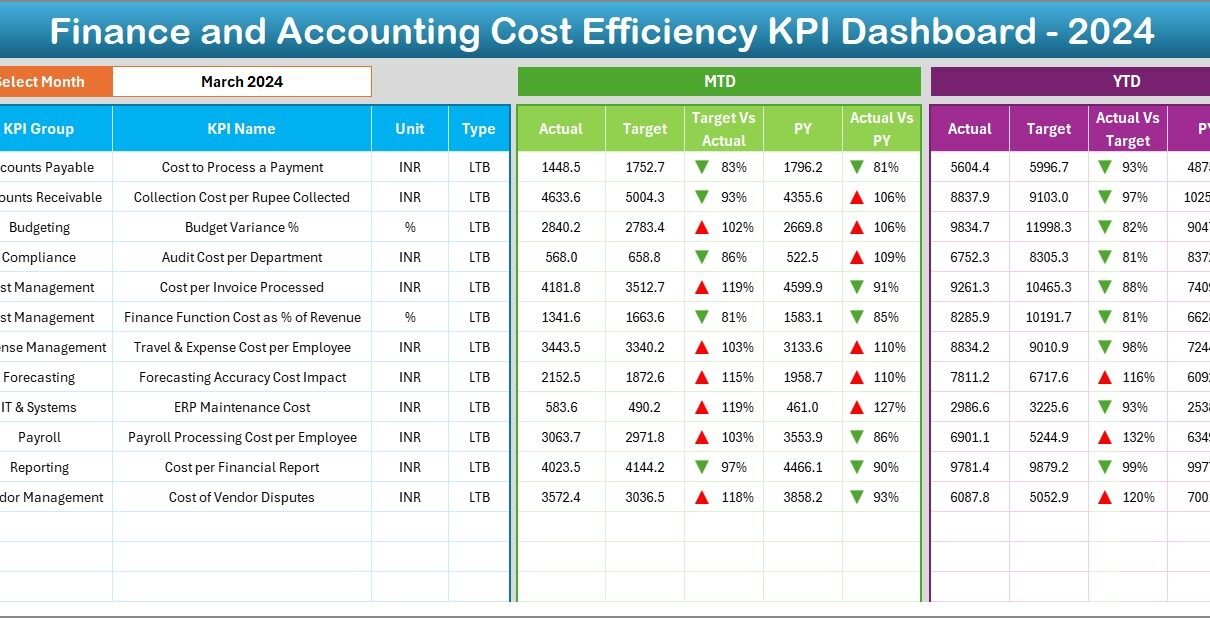
Finance and Accounting Cost Efficiency KPI Dashboard in Excel

April 19, 2025April 19, 2025 PKComments Off on Finance and Accounting Cost Efficiency KPI Dashboard in Excel
Managing cost efficiency in finance and accounting is essential for business success. However, tracking all the moving parts can be overwhelming without the right tools. That’s where the Finance and
Read More
Power BI

Fashion KPI Dashboard in Power BI

January 28, 2025April 6, 2025 PKComments Off on Fashion KPI Dashboard in Power BI
Fashion is an ever-evolving industry where data-driven decisions are essential to maintain efficiency and profitability. One powerful way to stay ahead in the game is by using a Fashion KPI
Read More
Power BI

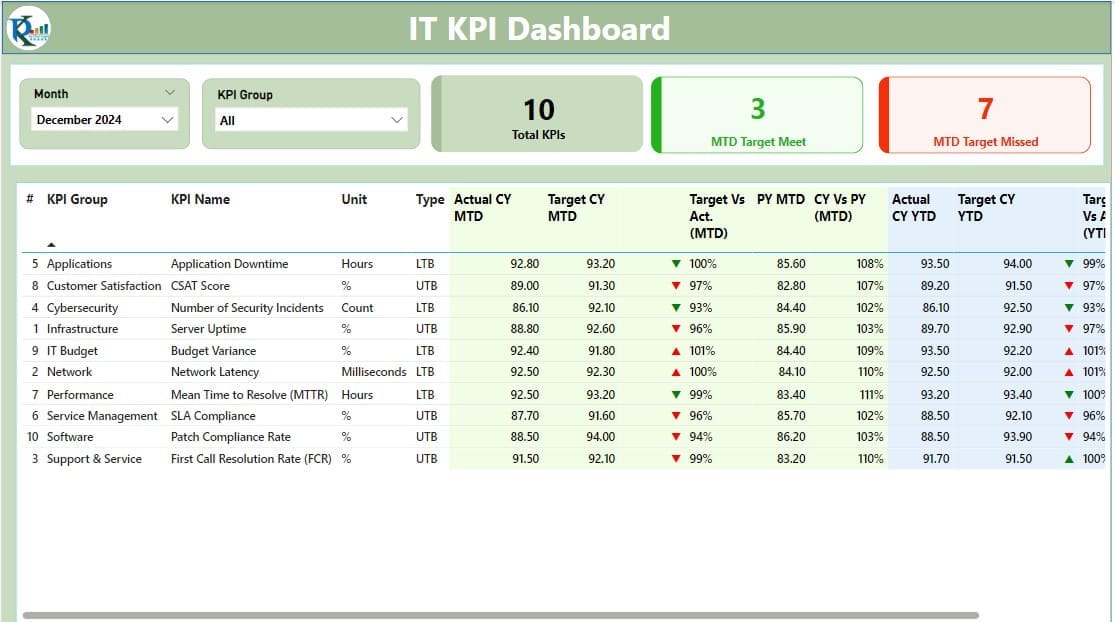
IT KPI Dashboard in Power BI

December 3, 2024March 2, 2025 PKComments Off on IT KPI Dashboard in Power BI
Tracking Key Performance Indicators (KPIs) is essential for any IT team aiming to achieve its goals efficiently. Using Power BI, you can create an IT KPI Dashboard that helps monitor
Read More
  • Learn Excel (Free Course)
    • 1. Shortcut Keys
    • 2. Fill & Flash Fill
    • 3. Find & Replace
    • 4. Sort & Filter
    • 5. Formulas & Functions
    • 6. Data Validation
    • 7. Conditional Formatting
    • 8. Basic Charts
    • 9. Advanced Charts
    • 10. Pivot Tables
    • 11. Excel Dashboards
    • 12. VBA Course
    • 13. Excel Formulas with AI
  • Templates
  • Tutorials
    • Charts and Visualization
    • VBA
    • Excel Tips and Tricks
    • Excel Dashboards
    • Power Pivot & DAX
  • Power BI
  • Template Store
    • Ready to Use Templates
  • Courses
  • Academy
    • Excel + AI Mastery: 100 Formulas
    • Excel Pivot Tables & Dashboards
  • About Us
  • Contact Us
Copyright © 2023 PK-AnExcelExpert.com - Privacy Policy