New: NextGenTemplates Academy - video courses on Excel formulas with AI and Pivot Tables & dashboards. Early-bird: 20% off with code EARLYBIRD20 - first 20 orders only. See the courses →
  • Learn Excel (Free Course)
    • 1. Shortcut Keys
    • 2. Fill & Flash Fill
    • 3. Find & Replace
    • 4. Sort & Filter
    • 5. Formulas & Functions
    • 6. Data Validation
    • 7. Conditional Formatting
    • 8. Basic Charts
    • 9. Advanced Charts
    • 10. Pivot Tables
    • 11. Excel Dashboards
    • 12. VBA Course
    • 13. Excel Formulas with AI
  • Templates
  • Tutorials
    • Charts and Visualization
    • VBA
    • Excel Tips and Tricks
    • Excel Dashboards
    • Power Pivot & DAX
  • Power BI
  • Template Store
    • Ready to Use Templates
  • Courses
  • Academy
    • Excel + AI Mastery: 100 Formulas
    • Excel Pivot Tables & Dashboards
  • About Us
  • Contact Us

PK: An Excel Expert

Transforming Data into Decisions

Tag: Net Promoter Score

Dashboard Power BI

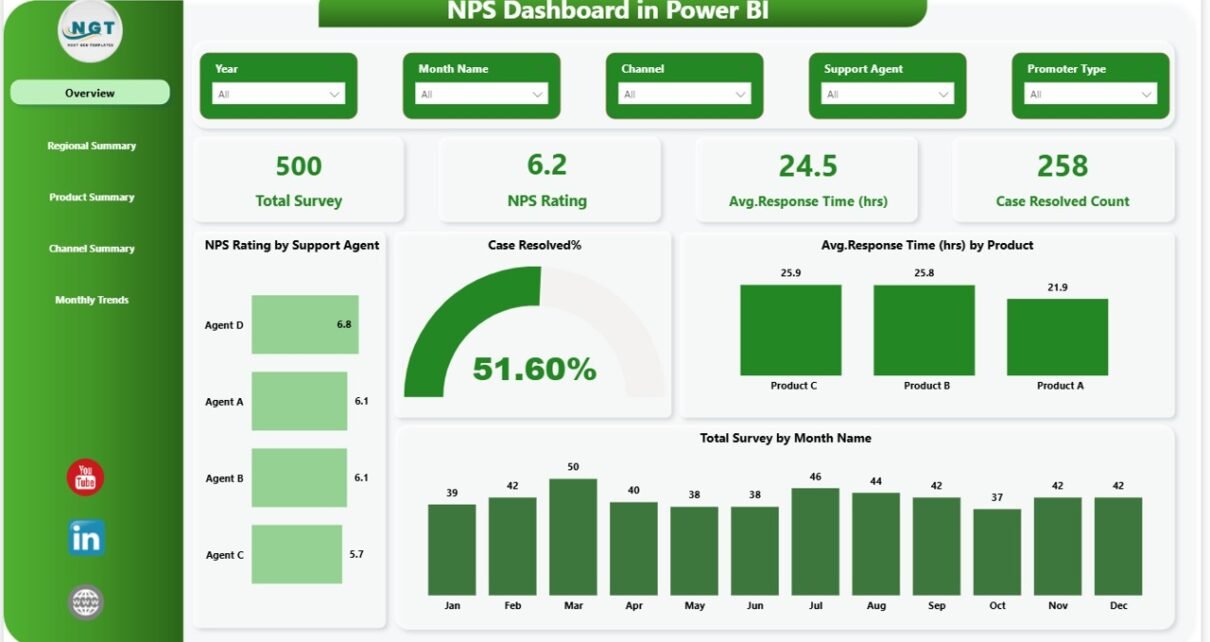
NPS Dashboard in Power BI

February 12, 2026February 12, 2026 PKComments Off on NPS Dashboard in Power BI
Customer loyalty decides business growth. However, many organizations still track customer feedback in scattered spreadsheets. As a result, leaders struggle to measure satisfaction, response time, and resolution rates clearly.So, how
Read More
Dashboard

Market Research Dashboard in Excel

January 17, 2026January 17, 2026 PKComments Off on Market Research Dashboard in Excel
Market research drives every successful business decision. Companies that understand customer needs, pricing sensitivity, satisfaction levels, and regional trends always stay ahead of competitors. However, raw survey data in Excel
Read More
Dashboard

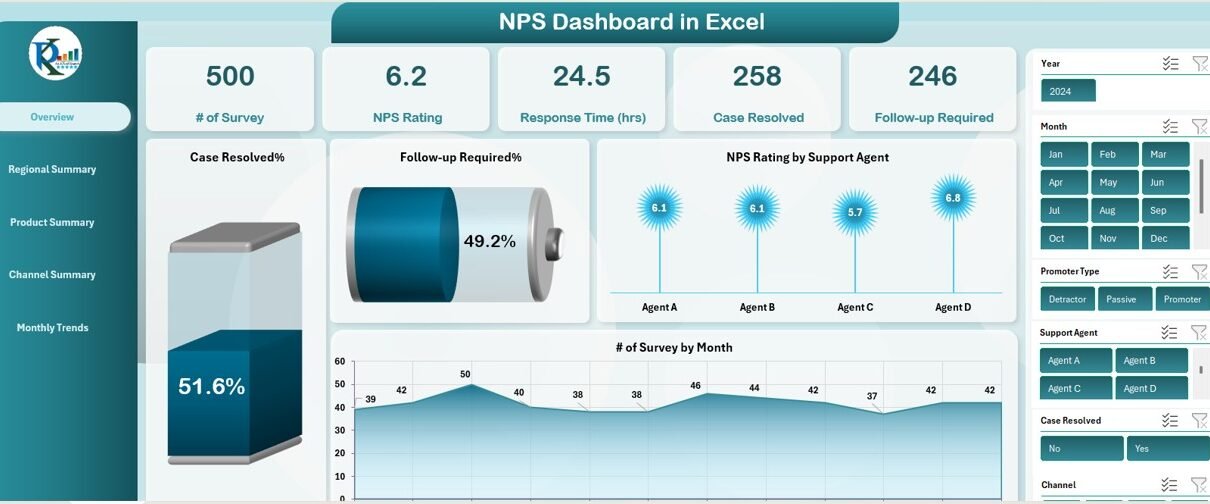
NPS Dashboard in Excel

June 23, 2025June 24, 2025 PKComments Off on NPS Dashboard in Excel
In today's highly competitive market, tracking customer satisfaction is essential for improving products, services, and overall business performance. One of the most effective ways to gauge customer satisfaction is by
Read More
Dashboard

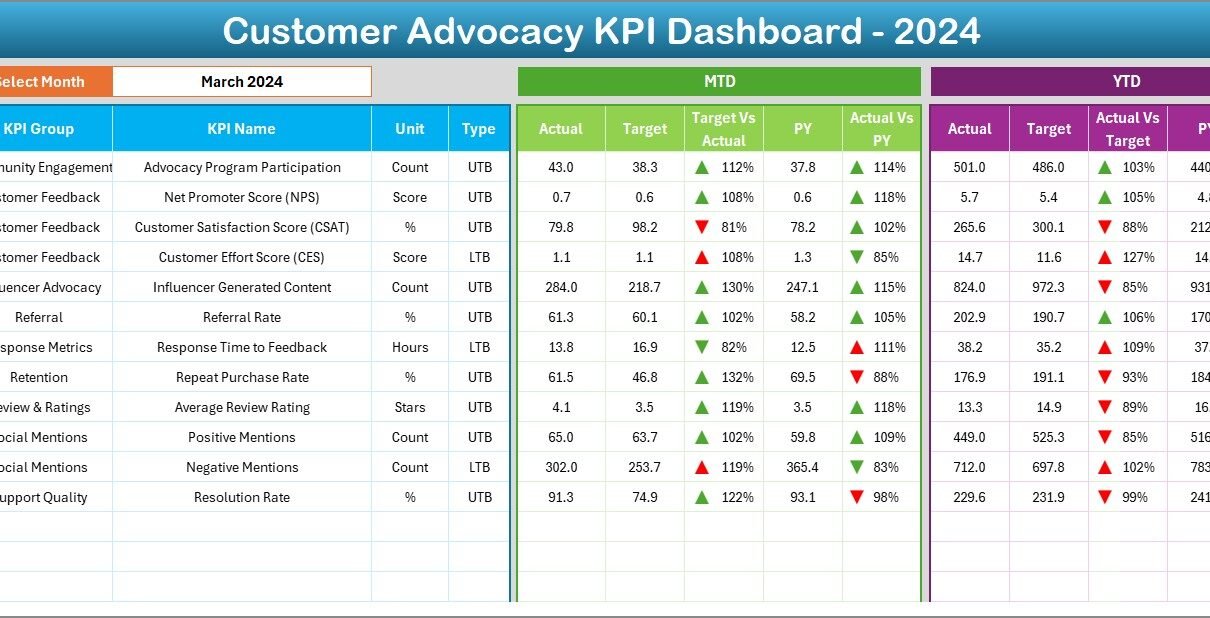
Customer Advocacy KPI Dashboard in Excel

April 16, 2025April 16, 2025 PKComments Off on Customer Advocacy KPI Dashboard in Excel
In today's competitive business world, customer advocacy is an essential driver of growth. By building strong relationships with customers and encouraging them to promote your brand, businesses can significantly improve
Read More
  • Learn Excel (Free Course)
    • 1. Shortcut Keys
    • 2. Fill & Flash Fill
    • 3. Find & Replace
    • 4. Sort & Filter
    • 5. Formulas & Functions
    • 6. Data Validation
    • 7. Conditional Formatting
    • 8. Basic Charts
    • 9. Advanced Charts
    • 10. Pivot Tables
    • 11. Excel Dashboards
    • 12. VBA Course
    • 13. Excel Formulas with AI
  • Templates
  • Tutorials
    • Charts and Visualization
    • VBA
    • Excel Tips and Tricks
    • Excel Dashboards
    • Power Pivot & DAX
  • Power BI
  • Template Store
    • Ready to Use Templates
  • Courses
  • Academy
    • Excel + AI Mastery: 100 Formulas
    • Excel Pivot Tables & Dashboards
  • About Us
  • Contact Us
Copyright © 2023 PK-AnExcelExpert.com - Privacy Policy