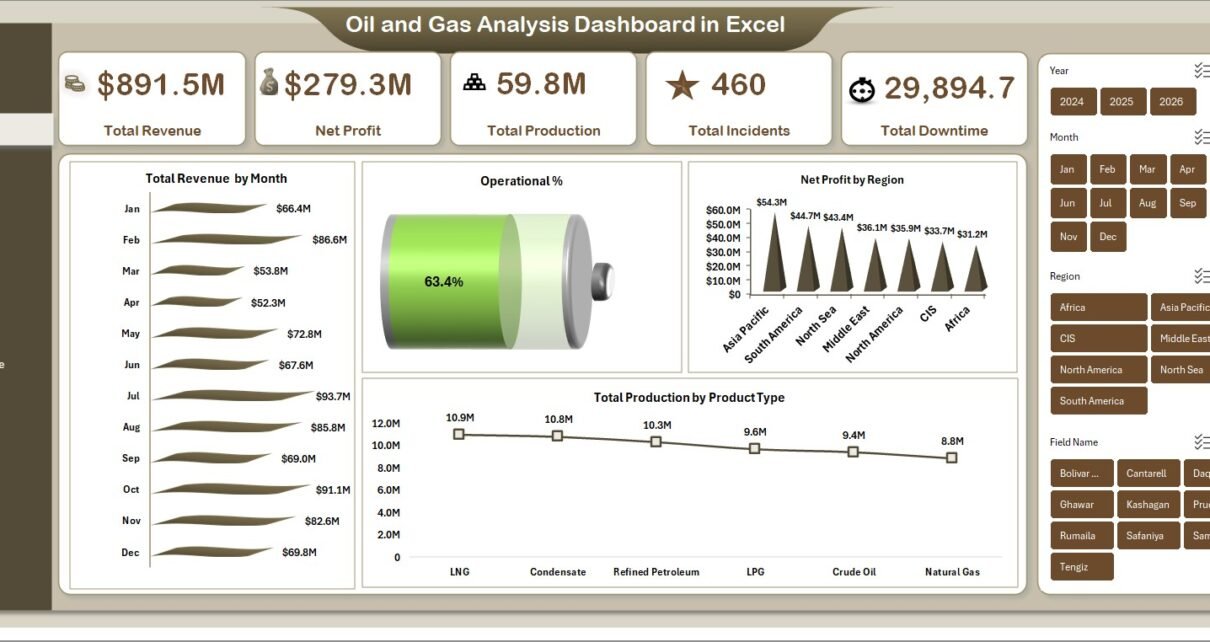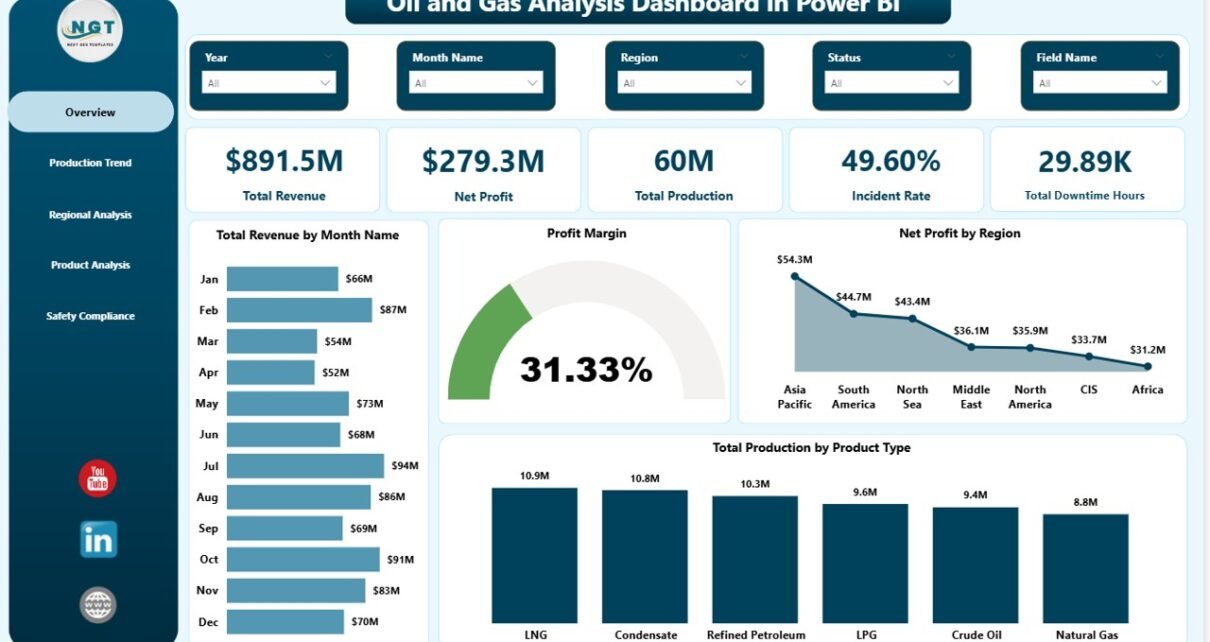
Oil and Gas Analysis Dashboard in Power BI
The Oil and Gas Analysis Dashboard in Power BI is built for upstream and downstream operators who want a single, refresh-ready board view of revenue, production, profit margin, downtime, and
Transforming Data into Decisions