New: NextGenTemplates Academy - video courses on Excel formulas with AI and Pivot Tables & dashboards. Early-bird: 20% off with code EARLYBIRD20 - first 20 orders only. See the courses →
  • Learn Excel (Free Course)
    • 1. Shortcut Keys
    • 2. Fill & Flash Fill
    • 3. Find & Replace
    • 4. Sort & Filter
    • 5. Formulas & Functions
    • 6. Data Validation
    • 7. Conditional Formatting
    • 8. Basic Charts
    • 9. Advanced Charts
    • 10. Pivot Tables
    • 11. Excel Dashboards
    • 12. VBA Course
    • 13. Excel Formulas with AI
  • Templates
  • Tutorials
    • Charts and Visualization
    • VBA
    • Excel Tips and Tricks
    • Excel Dashboards
    • Power Pivot & DAX
  • Power BI
  • Template Store
    • Ready to Use Templates
  • Courses
  • Academy
    • Excel + AI Mastery: 100 Formulas
    • Excel Pivot Tables & Dashboards
  • About Us
  • Contact Us

PK: An Excel Expert

Transforming Data into Decisions

Tag: performance analysis

Power BI

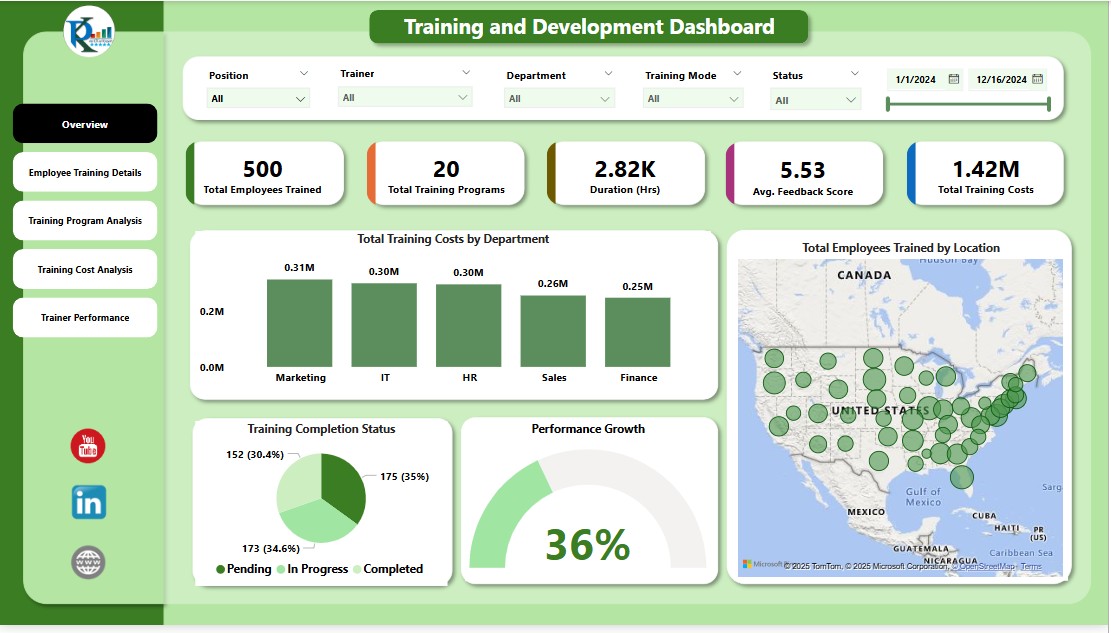
Training and Development Dashboard in Power BI

February 5, 2025February 24, 2025 PKComments Off on Training and Development Dashboard in Power BI
In today's rapidly evolving corporate world, the need for an efficient training and development program is crucial for enhancing employee performance. Companies are now using powerful business intelligence tools, such
Read More
Dashboard

Partner Onboarding KPI Dashboard in Excel

January 27, 2025April 8, 2025 PKComments Off on Partner Onboarding KPI Dashboard in Excel
Efficient partner onboarding is crucial for any organization seeking to build and maintain strong business relationships. A well-designed Partner Onboarding KPI Dashboard in Excel can simplify this process by tracking
Read More
Dashboard

Distributor Performance KPI Dashboard in Excel

January 26, 2025April 9, 2025 PKComments Off on Distributor Performance KPI Dashboard in Excel
In the competitive business world, distributors play a critical role in ensuring a seamless supply chain. Monitoring and analyzing their performance is essential for maintaining efficiency and meeting organizational goals.
Read More
Dashboard

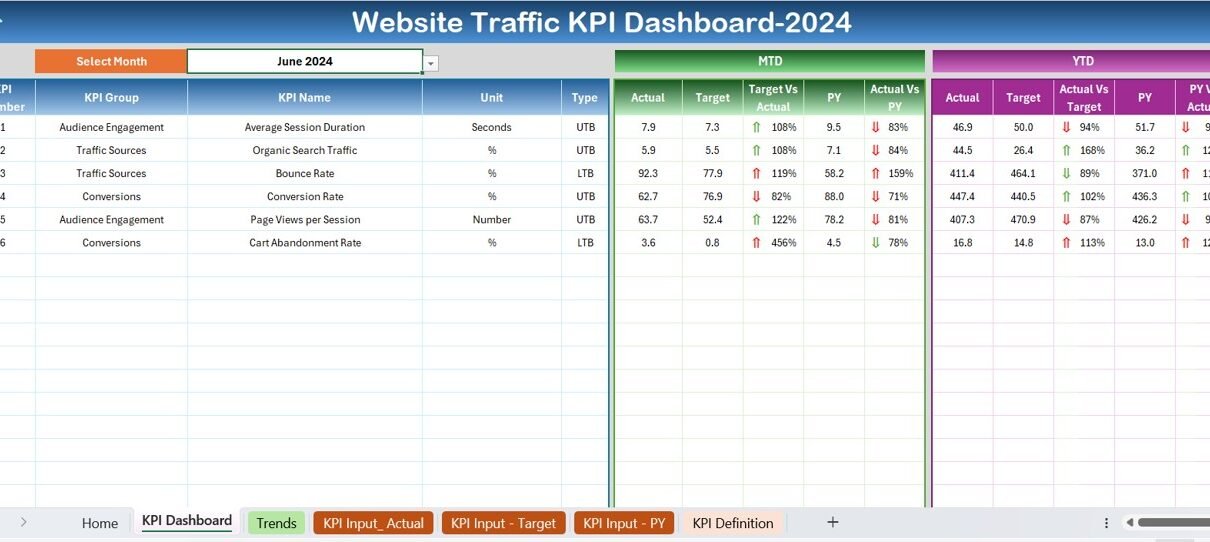
Website Traffic KPI Dashboard in Excel

January 24, 2025March 19, 2025 PKComments Off on Website Traffic KPI Dashboard in Excel
In today's digital age, understanding and monitoring your website's performance is crucial. The Website Traffic KPI Dashboard in Excel is an invaluable tool for digital marketers, webmasters, and business analysts.
Read More
Dashboard

Vocational Training KPI Dashboard in Excel

January 21, 2025March 23, 2025 PKComments Off on Vocational Training KPI Dashboard in Excel
In today’s fast-paced world, vocational training programs play a vital role in equipping individuals with the skills necessary for various trades. However, tracking the effectiveness of these training programs can
Read More
Dashboard

Power Grid KPI Dashboard in Excel

January 20, 2025March 23, 2025 PKComments Off on Power Grid KPI Dashboard in Excel
Introduction In the evolving landscape of the power grid industry, decision-makers need efficient tools to monitor key performance indicators (KPIs) that drive operational success. Excel remains a robust platform for
Read More
Dashboard

Energy Trading KPI Dashboard in Excel

January 20, 2025October 10, 2026 PKComments Off on Energy Trading KPI Dashboard in Excel
In the dynamic world of energy trading, staying ahead means keeping a keen eye on performance metrics that drive success. This article introduces an innovative solution: the Energy Trading KPI
Read More
Power BI

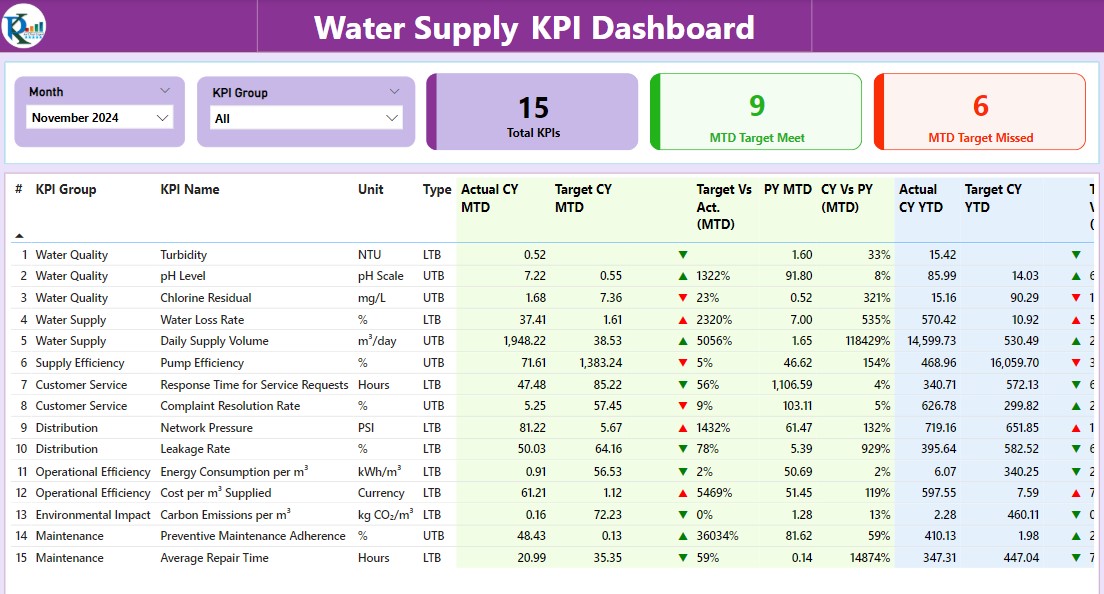
Water Supply KPI Dashboard in Power BI

January 15, 2025March 27, 2025 PKComments Off on Water Supply KPI Dashboard in Power BI
Water supply systems are essential to the efficient management of urban environments and the protection of natural resources. Implementing a Water Supply KPI Dashboard in Power BI enables utility managers
Read More
Dashboard

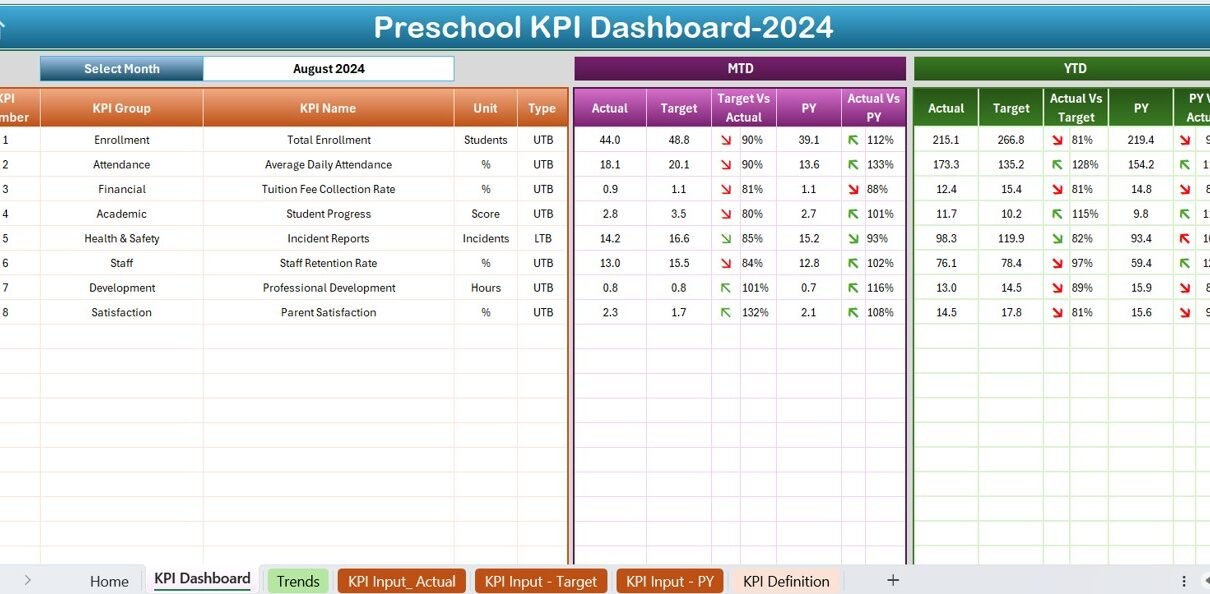
Preschool KPI Dashboard in Excel

January 15, 2025March 27, 2025 PKComments Off on Preschool KPI Dashboard in Excel
Key Performance Indicators (KPIs) are crucial for the strategic management of educational institutions, including preschools. They help track performance against educational goals, fostering better decision-making and enhanced child development outcomes.
Read More
Dashboard

E-Sports KPI Dashboard in Excel

December 26, 2024April 9, 2025 PKComments Off on E-Sports KPI Dashboard in Excel
The e-sports industry has rapidly evolved over the years, becoming a multi-billion-dollar market with a global fanbase. As the competition intensifies, managing and tracking the performance of players, teams, and
Read More

Posts pagination

Previous 1 2 3 Next
  • Learn Excel (Free Course)
    • 1. Shortcut Keys
    • 2. Fill & Flash Fill
    • 3. Find & Replace
    • 4. Sort & Filter
    • 5. Formulas & Functions
    • 6. Data Validation
    • 7. Conditional Formatting
    • 8. Basic Charts
    • 9. Advanced Charts
    • 10. Pivot Tables
    • 11. Excel Dashboards
    • 12. VBA Course
    • 13. Excel Formulas with AI
  • Templates
  • Tutorials
    • Charts and Visualization
    • VBA
    • Excel Tips and Tricks
    • Excel Dashboards
    • Power Pivot & DAX
  • Power BI
  • Template Store
    • Ready to Use Templates
  • Courses
  • Academy
    • Excel + AI Mastery: 100 Formulas
    • Excel Pivot Tables & Dashboards
  • About Us
  • Contact Us
Copyright © 2023 PK-AnExcelExpert.com - Privacy Policy