New: NextGenTemplates Academy - video courses on Excel formulas with AI and Pivot Tables & dashboards. Early-bird: 20% off with code EARLYBIRD20 - first 20 orders only. See the courses →
  • Learn Excel (Free Course)
    • 1. Shortcut Keys
    • 2. Fill & Flash Fill
    • 3. Find & Replace
    • 4. Sort & Filter
    • 5. Formulas & Functions
    • 6. Data Validation
    • 7. Conditional Formatting
    • 8. Basic Charts
    • 9. Advanced Charts
    • 10. Pivot Tables
    • 11. Excel Dashboards
    • 12. VBA Course
    • 13. Excel Formulas with AI
  • Templates
  • Tutorials
    • Charts and Visualization
    • VBA
    • Excel Tips and Tricks
    • Excel Dashboards
    • Power Pivot & DAX
  • Power BI
  • Template Store
    • Ready to Use Templates
  • Courses
  • Academy
    • Excel + AI Mastery: 100 Formulas
    • Excel Pivot Tables & Dashboards
  • About Us
  • Contact Us

PK: An Excel Expert

Transforming Data into Decisions

Tag: Performance Metrics

Dashboard

Claim Settlement KPI Dashboard in Excel

February 9, 2025March 19, 2025 PKComments Off on Claim Settlement KPI Dashboard in Excel
In the fast-moving world of insurance, keeping track of claim settlements is essential. A Claim Settlement KPI Dashboard in Excel provides an efficient way to monitor key performance indicators (KPIs)
Read More
Dashboard

Pension Fund KPI Dashboard in Excel

February 8, 2025March 20, 2025 PKComments Off on Pension Fund KPI Dashboard in Excel
Managing pension funds efficiently requires robust tracking of key performance indicators (KPIs). A Pension Fund KPI Dashboard in Excel is a powerful tool that provides real-time insights into fund performance,
Read More
Dashboard

Financial Risk KPI Dashboard in Excel

February 7, 2025March 22, 2025 PKComments Off on Financial Risk KPI Dashboard in Excel
Managing financial risks is crucial for any business. Tracking key performance indicators (KPIs) helps organizations stay on top of potential risks and make informed decisions. The Financial Risk KPI Dashboard
Read More
Power BI

Customer Experience KPI Dashboard in Power BI

February 3, 2025April 1, 2025 PKComments Off on Customer Experience KPI Dashboard in Power BI
In today’s business landscape, providing an outstanding customer experience (CX) is crucial for the success of any organization. With customers being the backbone of any business, it's essential to monitor
Read More
Dashboard

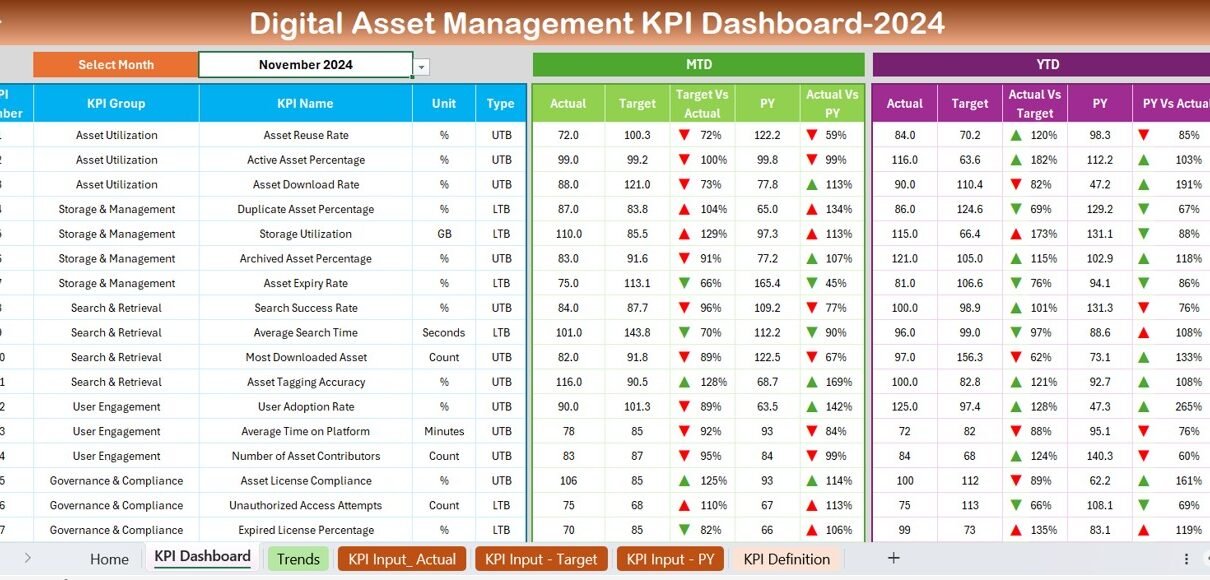
Digital Asset Management KPI Dashboard in Excel

January 30, 2025April 3, 2025 PKComments Off on Digital Asset Management KPI Dashboard in Excel
Managing digital assets effectively is crucial for businesses that deal with large volumes of digital content. To ensure efficiency and performance tracking, organizations use Digital Asset Management KPI Dashboards in
Read More
Dashboard

Bug Resolution KPI Dashboard in Excel

January 29, 2025March 31, 2025 PKComments Off on Bug Resolution KPI Dashboard in Excel
In today's fast-paced software development environment, tracking and resolving bugs efficiently is crucial for maintaining software quality. A Bug Resolution KPI Dashboard in Excel provides an effective way to monitor,
Read More
Dashboard

Affiliate Program KPI Dashboard in Excel

January 25, 2025March 19, 2025 PKComments Off on Affiliate Program KPI Dashboard in Excel
Introduction In today's data-driven world, managing and monitoring the performance of affiliate programs is crucial for maximizing return on investment. An Affiliate Program KPI Dashboard Key Performance Indicator (KPI) Dashboard
Read More
Dashboard

Cloud Computing KPI Dashboard in Excel

January 24, 2025March 19, 2025 PKComments Off on Cloud Computing KPI Dashboard in Excel
Cloud computing has become an essential part of modern business infrastructure, providing companies with the flexibility, scalability, and cost-efficiency they need to manage their operations. As businesses move more of
Read More
Dashboard

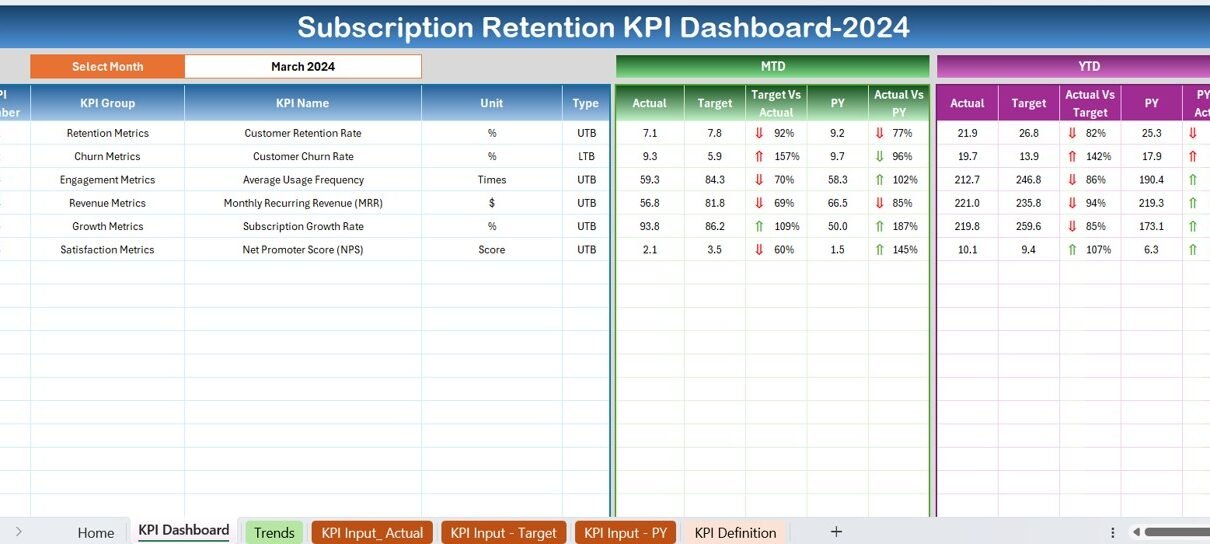
Subscription Retention KPI Dashboard in Excel

January 23, 2025March 20, 2025 PKComments Off on Subscription Retention KPI Dashboard in Excel
Understanding and enhancing customer retention is pivotal for any subscription-based business. The Subscription Retention KPI (Key Performance Indicator) Dashboard in Excel empowers businesses to track and analyze crucial metrics effortlessly.
Read More
Power BI

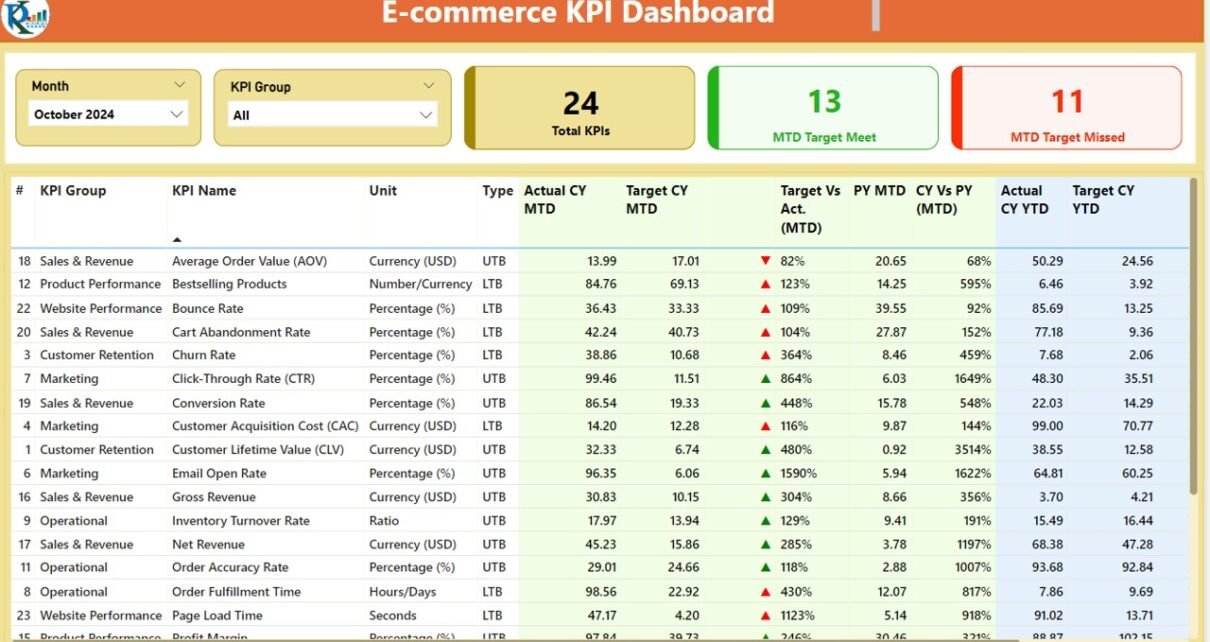
E-commerce KPI Dashboard in Power BI

January 18, 2025March 24, 2025 PKComments Off on E-commerce KPI Dashboard in Power BI
In the fast-paced world of e-commerce, businesses need to constantly track key performance indicators (KPIs) to measure success, optimize strategies, and stay competitive. With the E-commerce KPI Dashboard in Power
Read More

Posts pagination

Previous 1 … 5 6 7 … 11 Next
  • Learn Excel (Free Course)
    • 1. Shortcut Keys
    • 2. Fill & Flash Fill
    • 3. Find & Replace
    • 4. Sort & Filter
    • 5. Formulas & Functions
    • 6. Data Validation
    • 7. Conditional Formatting
    • 8. Basic Charts
    • 9. Advanced Charts
    • 10. Pivot Tables
    • 11. Excel Dashboards
    • 12. VBA Course
    • 13. Excel Formulas with AI
  • Templates
  • Tutorials
    • Charts and Visualization
    • VBA
    • Excel Tips and Tricks
    • Excel Dashboards
    • Power Pivot & DAX
  • Power BI
  • Template Store
    • Ready to Use Templates
  • Courses
  • Academy
    • Excel + AI Mastery: 100 Formulas
    • Excel Pivot Tables & Dashboards
  • About Us
  • Contact Us
Copyright © 2023 PK-AnExcelExpert.com - Privacy Policy