New: NextGenTemplates Academy - video courses on Excel formulas with AI and Pivot Tables & dashboards. Early-bird: 20% off with code EARLYBIRD20 - first 20 orders only. See the courses →
  • Learn Excel (Free Course)
    • 1. Shortcut Keys
    • 2. Fill & Flash Fill
    • 3. Find & Replace
    • 4. Sort & Filter
    • 5. Formulas & Functions
    • 6. Data Validation
    • 7. Conditional Formatting
    • 8. Basic Charts
    • 9. Advanced Charts
    • 10. Pivot Tables
    • 11. Excel Dashboards
    • 12. VBA Course
    • 13. Excel Formulas with AI
  • Templates
  • Tutorials
    • Charts and Visualization
    • VBA
    • Excel Tips and Tricks
    • Excel Dashboards
    • Power Pivot & DAX
  • Power BI
  • Template Store
    • Ready to Use Templates
  • Courses
  • Academy
    • Excel + AI Mastery: 100 Formulas
    • Excel Pivot Tables & Dashboards
  • About Us
  • Contact Us

PK: An Excel Expert

Transforming Data into Decisions

Tag: Performance Metrics

Power BI

Healthcare KPI Dashboard in Power BI

December 12, 2024March 6, 2025 PKComments Off on Healthcare KPI Dashboard in Power BI
The healthcare industry thrives on efficiency, quality of care, and patient satisfaction. To achieve these goals, healthcare organizations need to monitor their performance closely. A Healthcare KPI Dashboard in Power
Read More
Dashboard

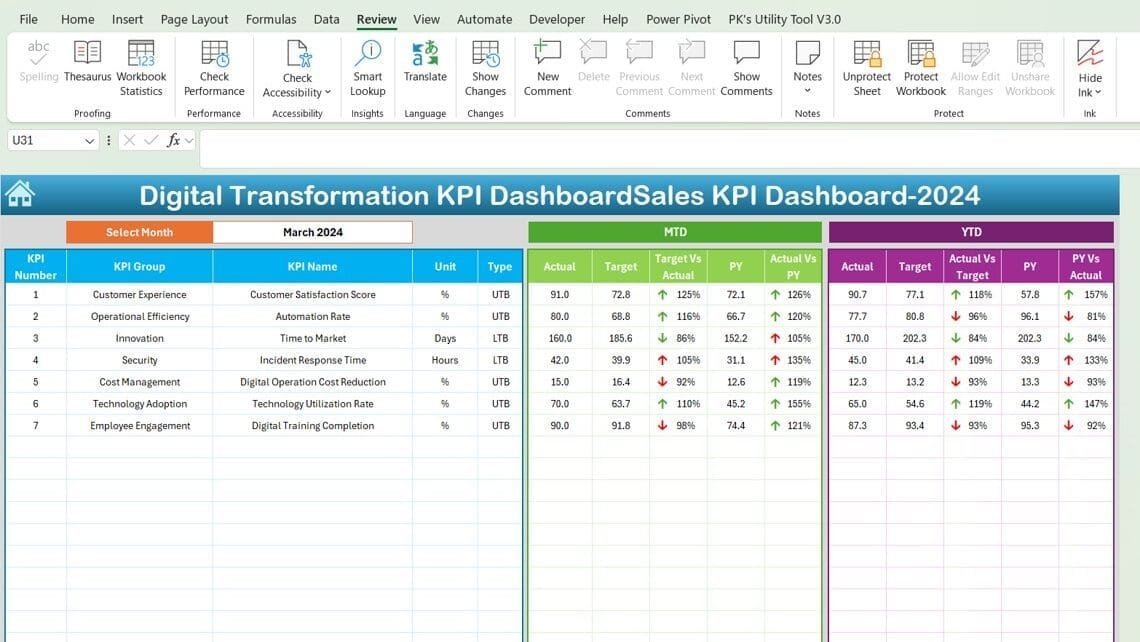
Digital Transformation KPI Dashboard in Excel

December 11, 2024March 5, 2025 PKComments Off on Digital Transformation KPI Dashboard in Excel
Digital transformation is pivotal in today's fast-evolving business landscape. To effectively manage and track the performance of digital transformation initiatives, a Key Performance Indicator (KPI) dashboard in Excel can be
Read More
Dashboard

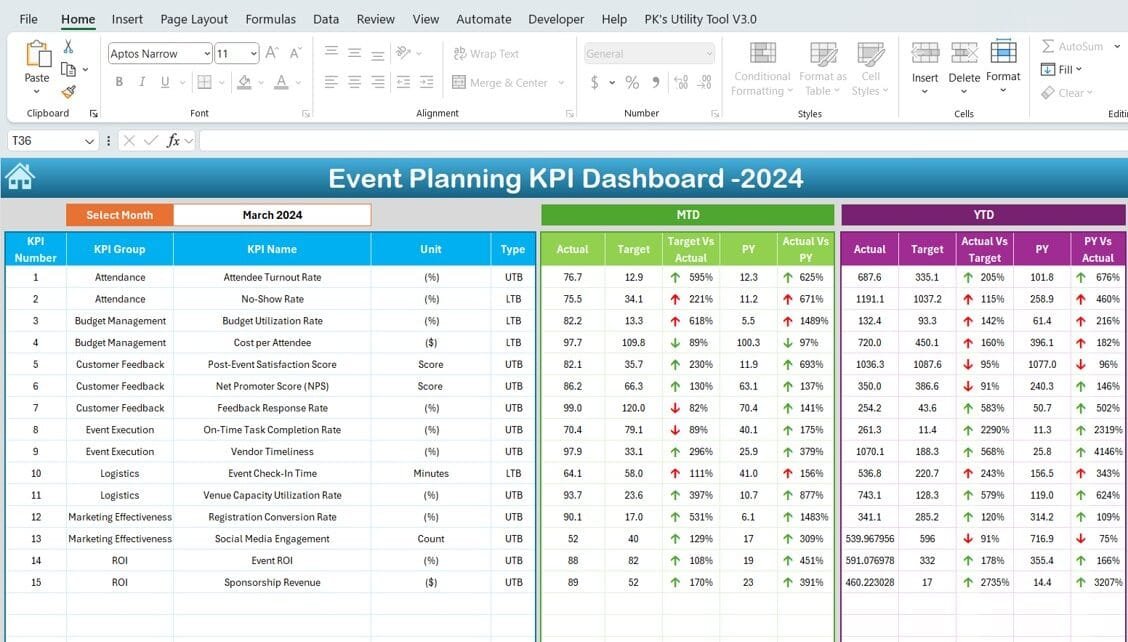
Event Planning KPI Dashboard In Excel

December 10, 2024March 5, 2025 PKComments Off on Event Planning KPI Dashboard In Excel
Effective event management requires precise tracking of performance metrics. The Event Planning KPI Dashboard is a robust tool designed to help event planners monitor critical KPIs, identify trends, and make
Read More
Dashboard

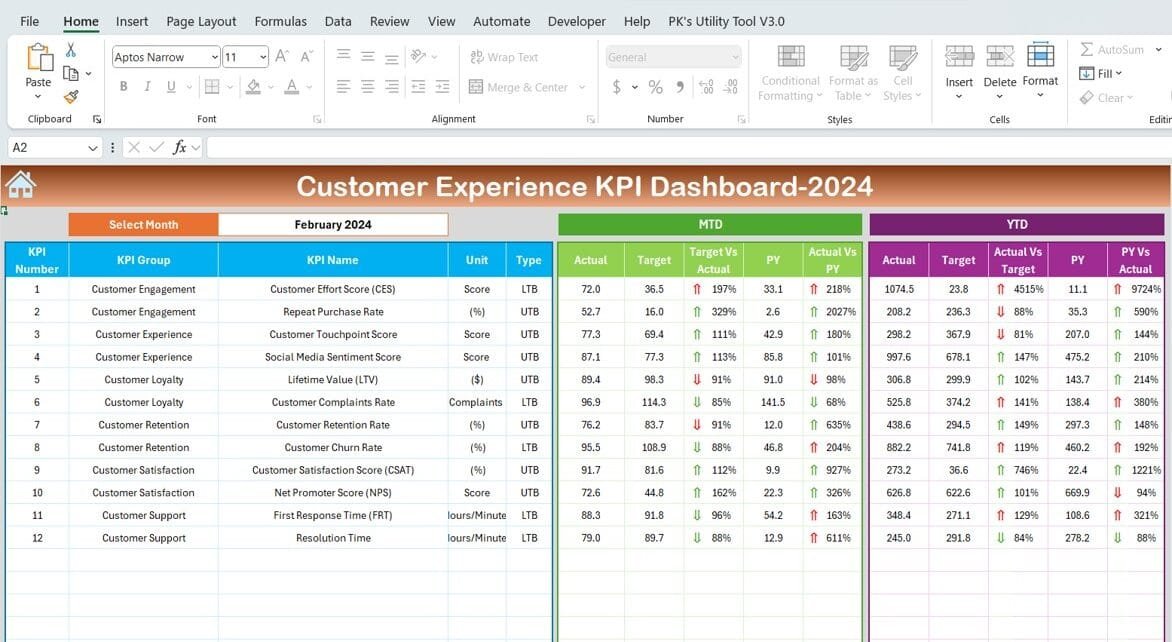
Customer Experience KPI Dashboard in Excel

December 10, 2024March 5, 2025 PKComments Off on Customer Experience KPI Dashboard in Excel
In today’s business landscape, customer experience (CX) plays a pivotal role in determining success. Monitoring and analyzing key performance indicators (KPIs) is essential to improve customer satisfaction, loyalty, and overall
Read More
Power BI

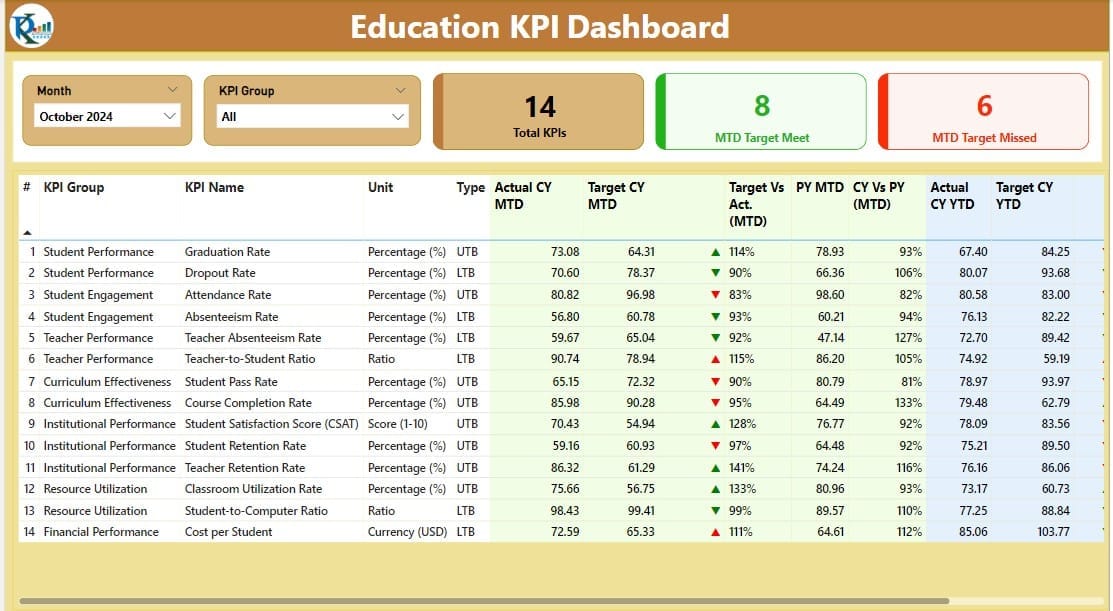
Education KPI Dashboard in Power BI

December 8, 2024March 4, 2025 PKComments Off on Education KPI Dashboard in Power BI
In today's data-driven educational environment, Key Performance Indicators (KPIs) play a crucial role in measuring and enhancing academic and administrative effectiveness. The Education KPI Dashboard in Power BI transforms raw
Read More
Dashboard

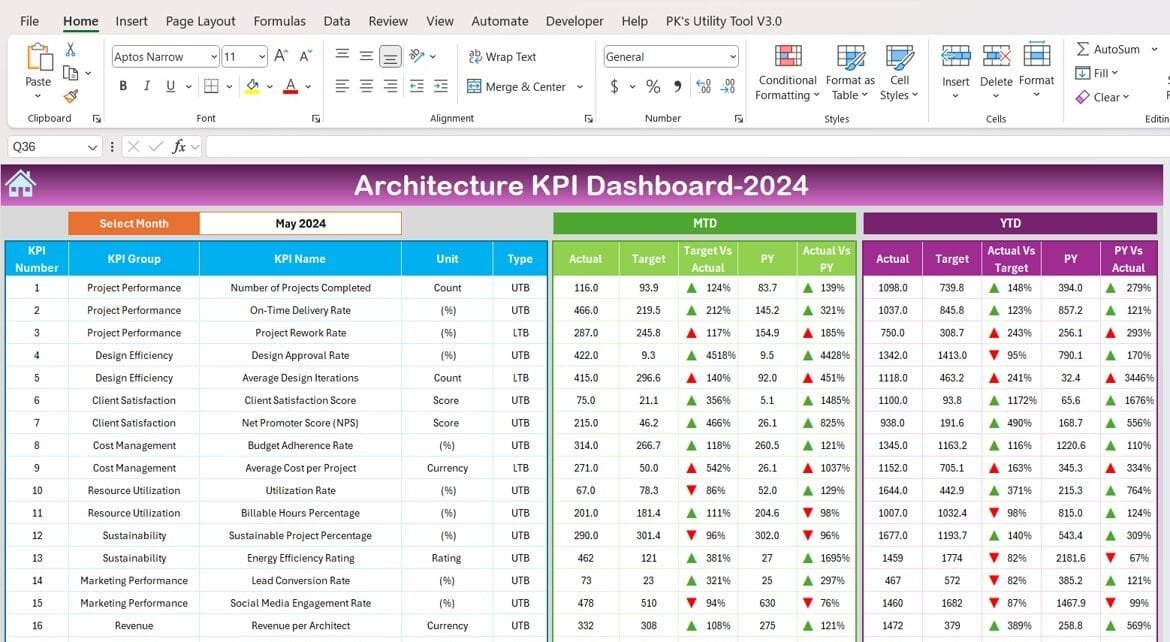
Architecture KPI Dashboard in Excel

December 6, 2024March 3, 2025 PKComments Off on Architecture KPI Dashboard in Excel
The architecture industry thrives on precision, creativity, and efficiency. With the increasing complexity of projects, tracking performance metrics has become essential. The Architecture KPI Dashboard in Excel offers a powerful
Read More
Dashboard

Interior Design KPI Dashboard in Excel

December 5, 2024March 3, 2025 PKComments Off on Interior Design KPI Dashboard in Excel
The interior design industry thrives on creativity, but managing the business side requires a solid strategy. Data is key to running successful operations, and that’s where the Interior Design KPI
Read More
Power BI

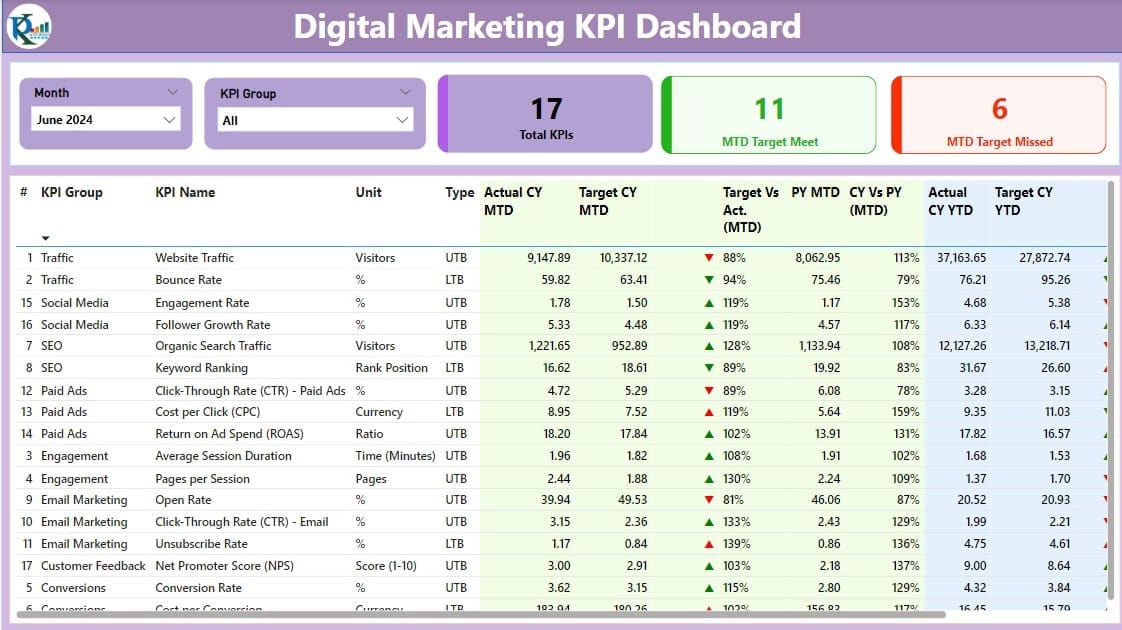
Digital Marketing KPI Dashboard in Power BI

December 4, 2024March 2, 2025 PKComments Off on Digital Marketing KPI Dashboard in Power BI
The Digital Marketing KPI Dashboard in Power BI is a versatile and user-friendly solution for tracking, managing, and visualizing your key performance indicators (KPIs). Whether you're monitoring ad campaigns, website
Read More
Dashboard

Petroleum Industry KPI Dashboard in Excel

December 4, 2024March 2, 2025 PKComments Off on Petroleum Industry KPI Dashboard in Excel
In the petroleum industry, efficient tracking of key performance indicators (KPIs) is critical for ensuring operational success, managing costs, and optimizing resources. A Petroleum Industry KPI Dashboard provides a centralized
Read More
Dashboard

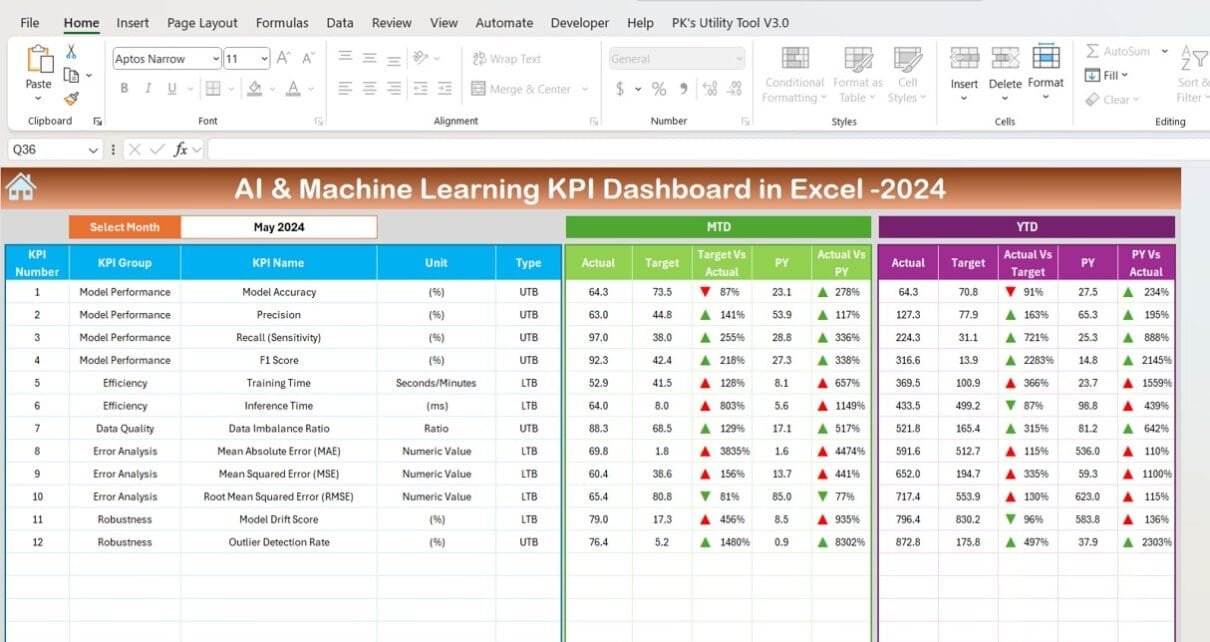
AI & Machine Learning KPI Dashboard in Excel

December 4, 2024March 2, 2025 PKComments Off on AI & Machine Learning KPI Dashboard in Excel
Tracking key performance indicators (KPIs) is essential for organizations working in AI and Machine Learning. An AI & Machine Learning KPI Dashboard is the perfect tool to monitor, analyze, and
Read More

Posts pagination

Previous 1 … 8 9 10 11 Next
  • Learn Excel (Free Course)
    • 1. Shortcut Keys
    • 2. Fill & Flash Fill
    • 3. Find & Replace
    • 4. Sort & Filter
    • 5. Formulas & Functions
    • 6. Data Validation
    • 7. Conditional Formatting
    • 8. Basic Charts
    • 9. Advanced Charts
    • 10. Pivot Tables
    • 11. Excel Dashboards
    • 12. VBA Course
    • 13. Excel Formulas with AI
  • Templates
  • Tutorials
    • Charts and Visualization
    • VBA
    • Excel Tips and Tricks
    • Excel Dashboards
    • Power Pivot & DAX
  • Power BI
  • Template Store
    • Ready to Use Templates
  • Courses
  • Academy
    • Excel + AI Mastery: 100 Formulas
    • Excel Pivot Tables & Dashboards
  • About Us
  • Contact Us
Copyright © 2023 PK-AnExcelExpert.com - Privacy Policy