New: NextGenTemplates Academy - video courses on Excel formulas with AI and Pivot Tables & dashboards. Early-bird: 20% off with code EARLYBIRD20 - first 20 orders only. See the courses →
  • Learn Excel (Free Course)
    • 1. Shortcut Keys
    • 2. Fill & Flash Fill
    • 3. Find & Replace
    • 4. Sort & Filter
    • 5. Formulas & Functions
    • 6. Data Validation
    • 7. Conditional Formatting
    • 8. Basic Charts
    • 9. Advanced Charts
    • 10. Pivot Tables
    • 11. Excel Dashboards
    • 12. VBA Course
    • 13. Excel Formulas with AI
  • Templates
  • Tutorials
    • Charts and Visualization
    • VBA
    • Excel Tips and Tricks
    • Excel Dashboards
    • Power Pivot & DAX
  • Power BI
  • Template Store
    • Ready to Use Templates
  • Courses
  • Academy
    • Excel + AI Mastery: 100 Formulas
    • Excel Pivot Tables & Dashboards
  • About Us
  • Contact Us

PK: An Excel Expert

Transforming Data into Decisions

Tag: Performance Monitoring Excel

Dashboard

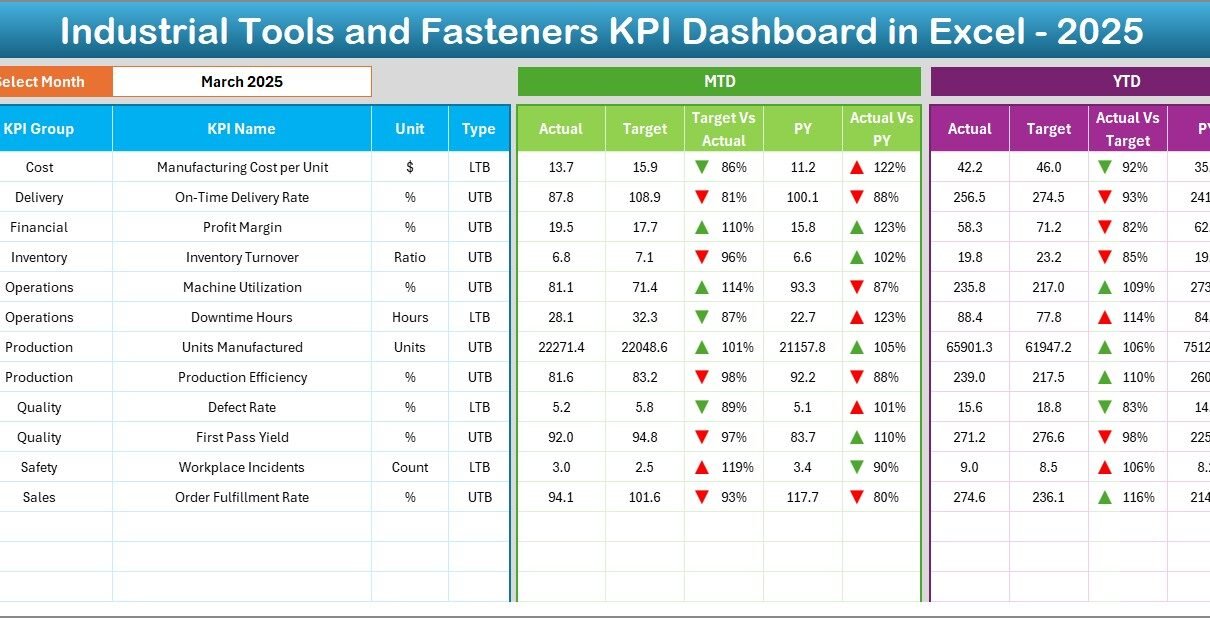
Industrial Tools and Fasteners KPI Dashboard in Excel

February 28, 2026February 28, 2026 PKComments Off on Industrial Tools and Fasteners KPI Dashboard in Excel
In today’s highly competitive manufacturing environment, companies that produce industrial tools and fasteners must continuously monitor performance to remain profitable and efficient. Manufacturers face increasing pressure to improve productivity, control
Read More
Dashboard

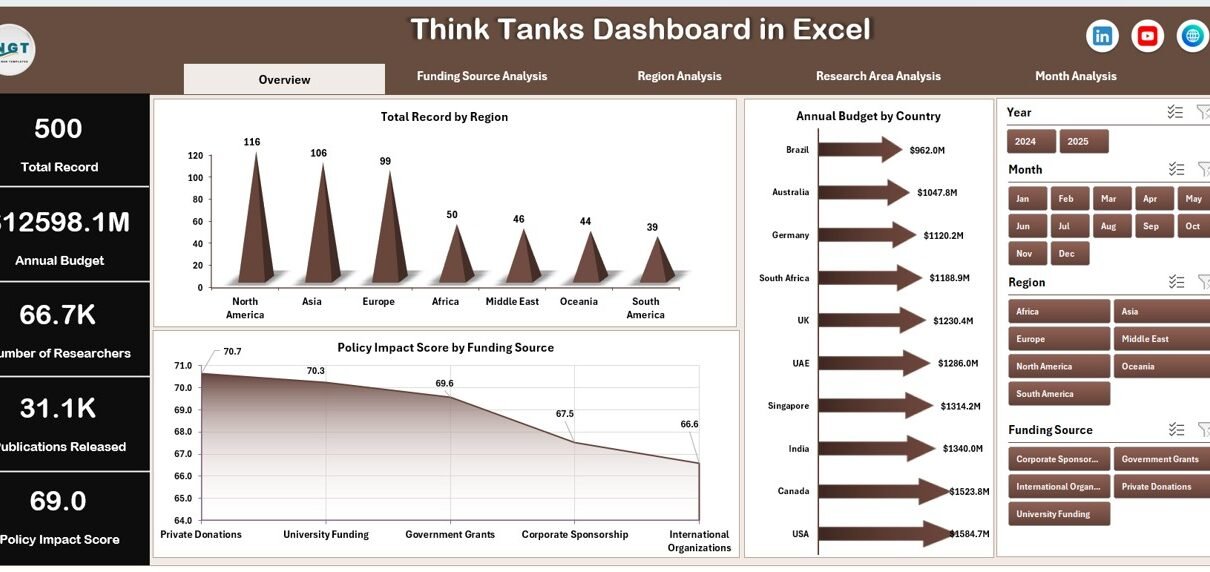
Think Tanks Dashboard in Excel

February 24, 2026February 24, 2026 PKComments Off on Think Tanks Dashboard in Excel
Think tanks play a critical role in shaping public policy, economic strategies, and social development. They conduct research, publish reports, organize events, and influence decision-making across governments, institutions, and organizations.
Read More
Dashboard

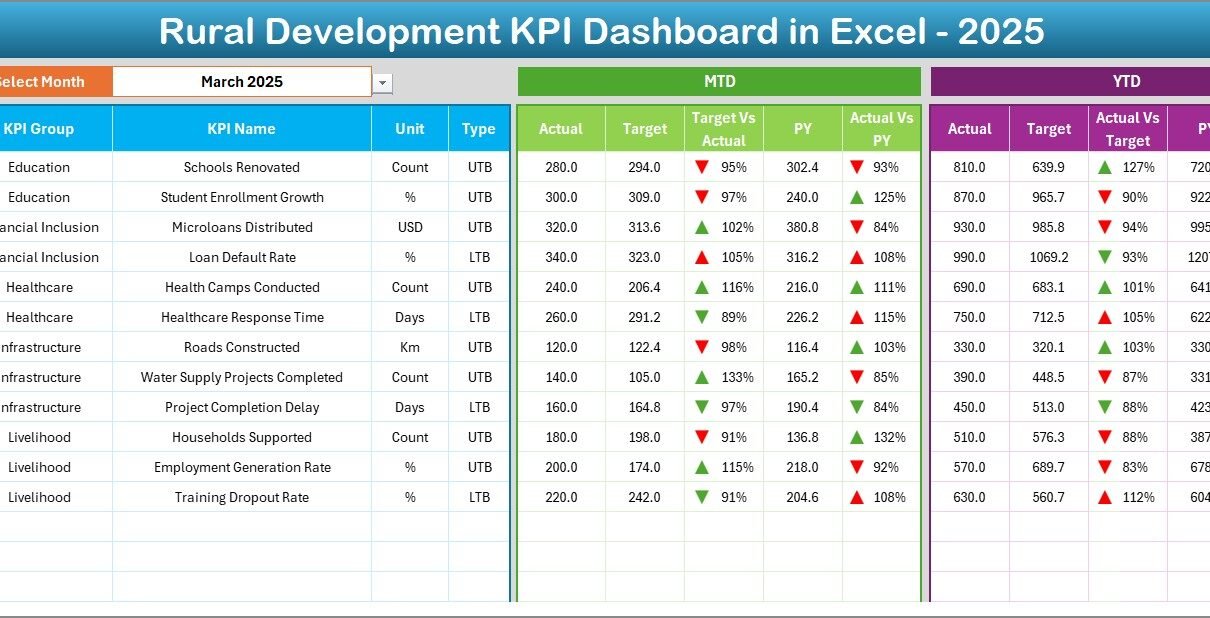
Rural Development KPI Dashboard in Excel

February 12, 2026February 12, 2026 PKComments Off on Rural Development KPI Dashboard in Excel
Rural development drives economic growth, improves livelihoods, and strengthens communities. However, many development teams still track progress in scattered spreadsheets. As a result, leaders struggle to monitor targets, compare yearly
Read More
Dashboard

Electricity Distribution KPI Dashboard in Excel

January 20, 2025March 23, 2025 PKComments Off on Electricity Distribution KPI Dashboard in Excel
In today's data-driven era, managing and analyzing performance metrics efficiently is crucial for electricity distribution companies. This article introduces the Electricity Distribution KPI Dashboard—a comprehensive tool that empowers organizations to
Read More
  • Learn Excel (Free Course)
    • 1. Shortcut Keys
    • 2. Fill & Flash Fill
    • 3. Find & Replace
    • 4. Sort & Filter
    • 5. Formulas & Functions
    • 6. Data Validation
    • 7. Conditional Formatting
    • 8. Basic Charts
    • 9. Advanced Charts
    • 10. Pivot Tables
    • 11. Excel Dashboards
    • 12. VBA Course
    • 13. Excel Formulas with AI
  • Templates
  • Tutorials
    • Charts and Visualization
    • VBA
    • Excel Tips and Tricks
    • Excel Dashboards
    • Power Pivot & DAX
  • Power BI
  • Template Store
    • Ready to Use Templates
  • Courses
  • Academy
    • Excel + AI Mastery: 100 Formulas
    • Excel Pivot Tables & Dashboards
  • About Us
  • Contact Us
Copyright © 2023 PK-AnExcelExpert.com - Privacy Policy