New: NextGenTemplates Academy - video courses on Excel formulas with AI and Pivot Tables & dashboards. Early-bird: 20% off with code EARLYBIRD20 - first 20 orders only. See the courses →
  • Learn Excel (Free Course)
    • 1. Shortcut Keys
    • 2. Fill & Flash Fill
    • 3. Find & Replace
    • 4. Sort & Filter
    • 5. Formulas & Functions
    • 6. Data Validation
    • 7. Conditional Formatting
    • 8. Basic Charts
    • 9. Advanced Charts
    • 10. Pivot Tables
    • 11. Excel Dashboards
    • 12. VBA Course
    • 13. Excel Formulas with AI
  • Templates
  • Tutorials
    • Charts and Visualization
    • VBA
    • Excel Tips and Tricks
    • Excel Dashboards
    • Power Pivot & DAX
  • Power BI
  • Template Store
    • Ready to Use Templates
  • Courses
  • Academy
    • Excel + AI Mastery: 100 Formulas
    • Excel Pivot Tables & Dashboards
  • About Us
  • Contact Us

PK: An Excel Expert

Transforming Data into Decisions

Tag: Port KPI Dashboard

Dashboard

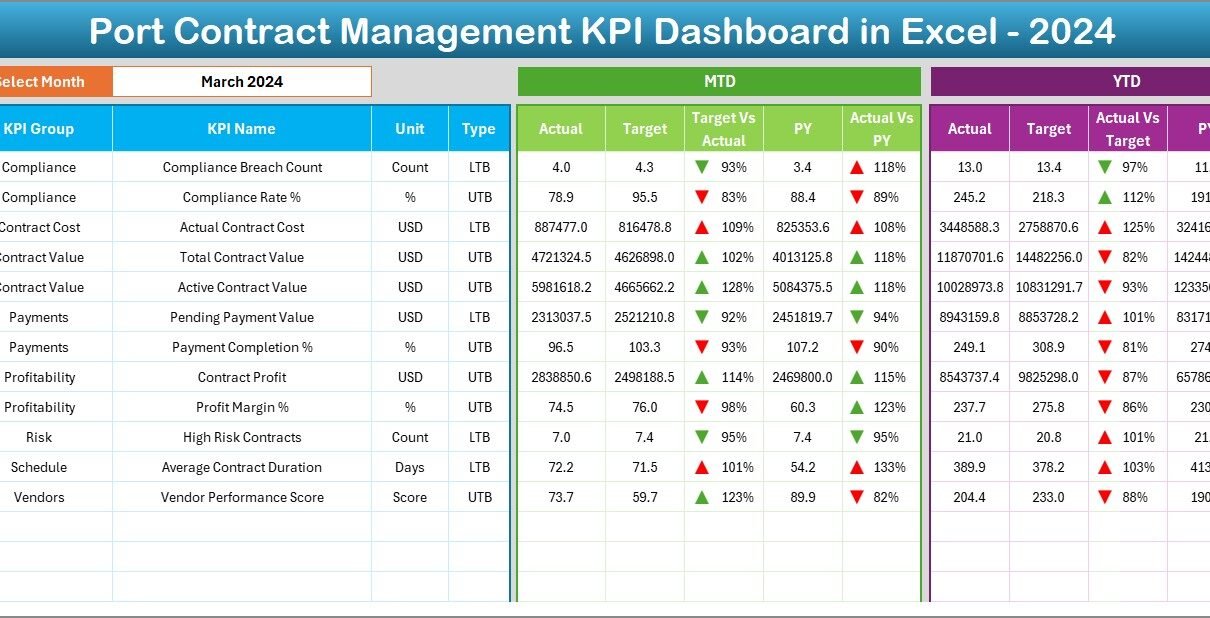
Port Contract Management KPI Dashboard in Excel

December 24, 2025December 24, 2025 PKComments Off on Port Contract Management KPI Dashboard in Excel
Managing contracts in port operations demands accuracy, speed, and full visibility. Ports handle high-value contracts related to terminal operations, logistics, maintenance, dredging, security, IT services, and infrastructure development. Therefore, contract
Read More
Dashboard

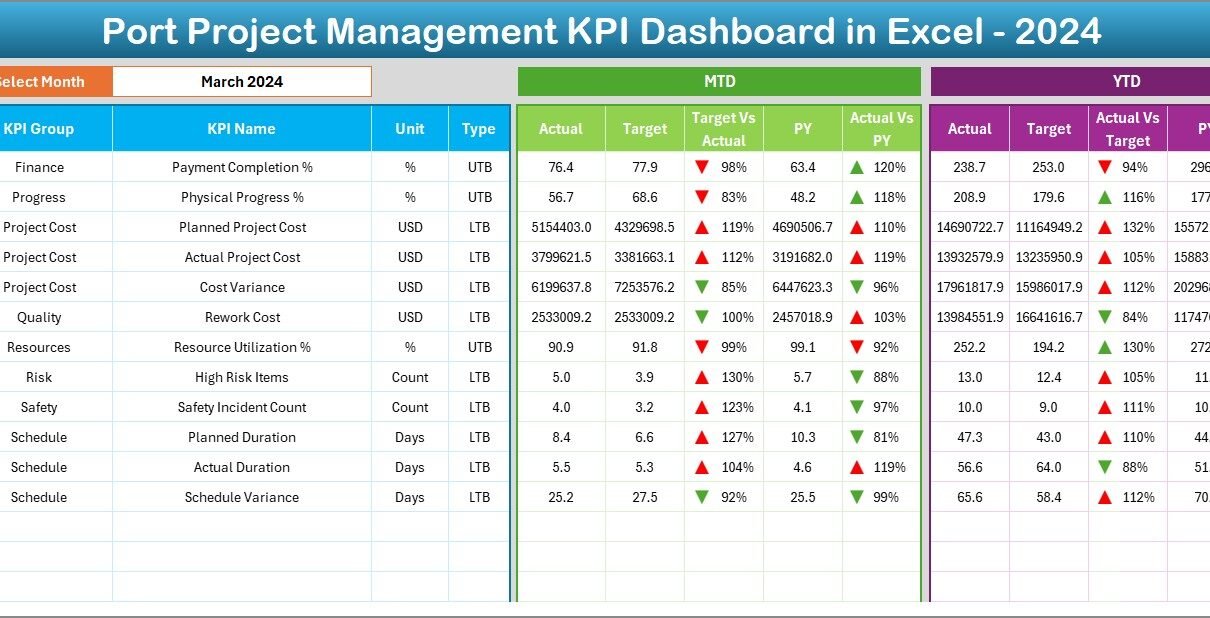
Port Project Management KPI Dashboard in Excel

December 24, 2025December 24, 2025 PKComments Off on Port Project Management KPI Dashboard in Excel
Managing port projects is never simple. Port authorities, terminal operators, EPC contractors, and logistics teams handle massive budgets, tight schedules, multiple vendors, strict compliance rules, and constant operational risks. However,
Read More
Dashboard

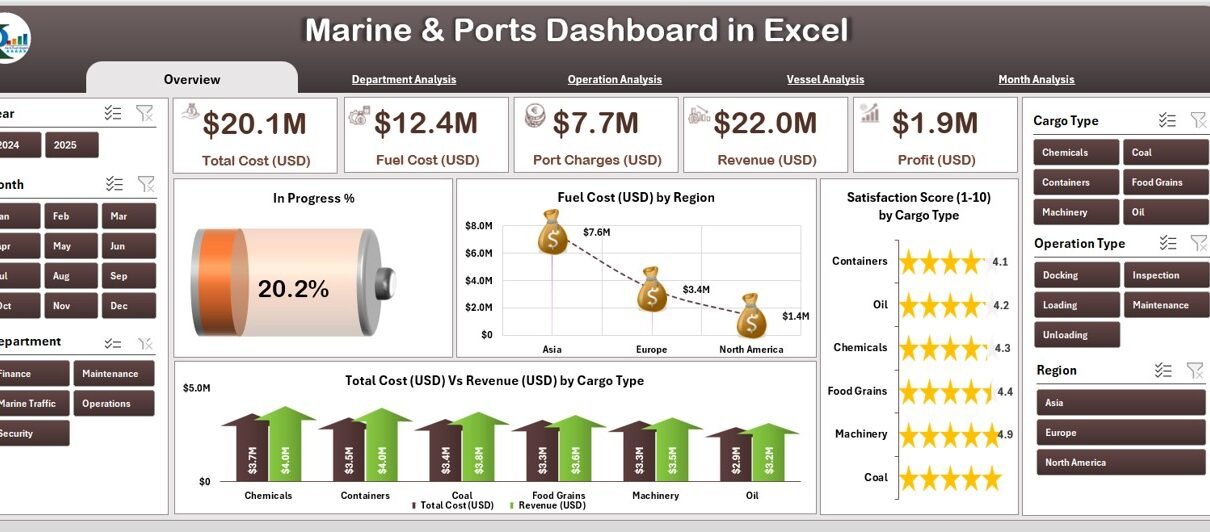
Marine & Ports Dashboard in Excel

October 29, 2025October 29, 2025 PKComments Off on Marine & Ports Dashboard in Excel
The maritime and port industry plays a vital role in global trade and logistics. From managing vessels and cargo operations to tracking costs and fuel consumption, every aspect of marine
Read More
Dashboard Power BI

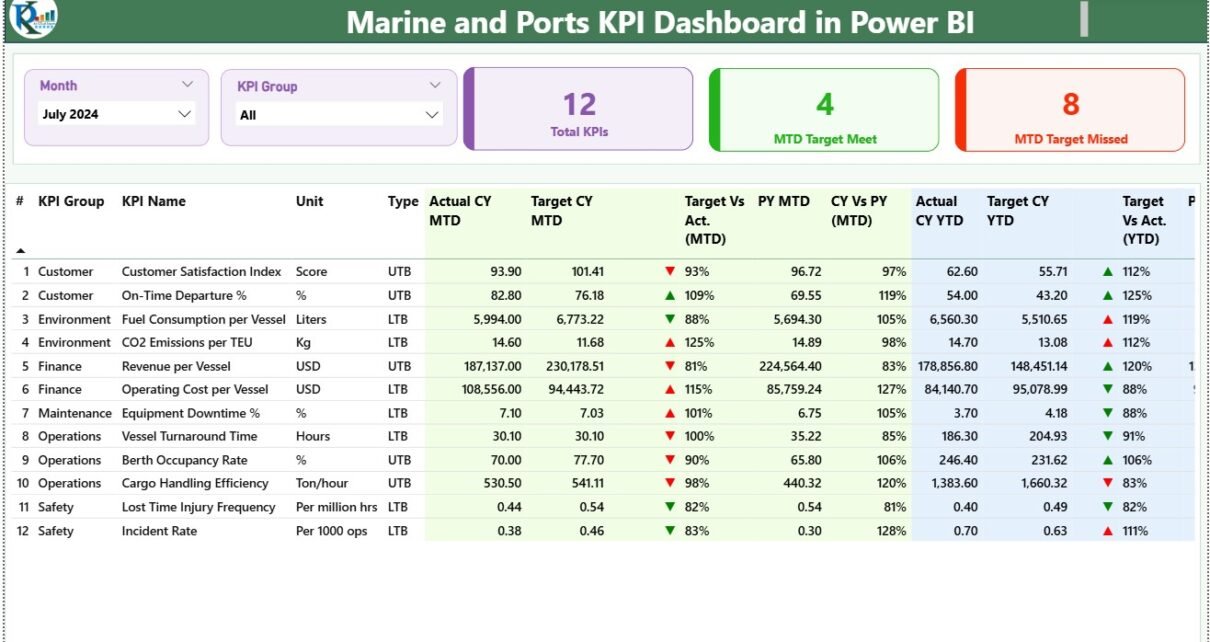
Marine and Ports KPI Dashboard in Power BI

October 27, 2025October 27, 2025 PKComments Off on Marine and Ports KPI Dashboard in Power BI
The maritime and port industry is one of the most complex and globally connected sectors. Every day, hundreds of ships, containers, and logistics operations move across ports and terminals worldwide.
Read More
  • Learn Excel (Free Course)
    • 1. Shortcut Keys
    • 2. Fill & Flash Fill
    • 3. Find & Replace
    • 4. Sort & Filter
    • 5. Formulas & Functions
    • 6. Data Validation
    • 7. Conditional Formatting
    • 8. Basic Charts
    • 9. Advanced Charts
    • 10. Pivot Tables
    • 11. Excel Dashboards
    • 12. VBA Course
    • 13. Excel Formulas with AI
  • Templates
  • Tutorials
    • Charts and Visualization
    • VBA
    • Excel Tips and Tricks
    • Excel Dashboards
    • Power Pivot & DAX
  • Power BI
  • Template Store
    • Ready to Use Templates
  • Courses
  • Academy
    • Excel + AI Mastery: 100 Formulas
    • Excel Pivot Tables & Dashboards
  • About Us
  • Contact Us
Copyright © 2023 PK-AnExcelExpert.com - Privacy Policy