New: NextGenTemplates Academy - video courses on Excel formulas with AI and Pivot Tables & dashboards. Early-bird: 20% off with code EARLYBIRD20 - first 20 orders only. See the courses →
  • Learn Excel (Free Course)
    • 1. Shortcut Keys
    • 2. Fill & Flash Fill
    • 3. Find & Replace
    • 4. Sort & Filter
    • 5. Formulas & Functions
    • 6. Data Validation
    • 7. Conditional Formatting
    • 8. Basic Charts
    • 9. Advanced Charts
    • 10. Pivot Tables
    • 11. Excel Dashboards
    • 12. VBA Course
    • 13. Excel Formulas with AI
  • Templates
  • Tutorials
    • Charts and Visualization
    • VBA
    • Excel Tips and Tricks
    • Excel Dashboards
    • Power Pivot & DAX
  • Power BI
  • Template Store
    • Ready to Use Templates
  • Courses
  • Academy
    • Excel + AI Mastery: 100 Formulas
    • Excel Pivot Tables & Dashboards
  • About Us
  • Contact Us

PK: An Excel Expert

Transforming Data into Decisions

Tag: Power BI dashboard

Dashboard Power BI

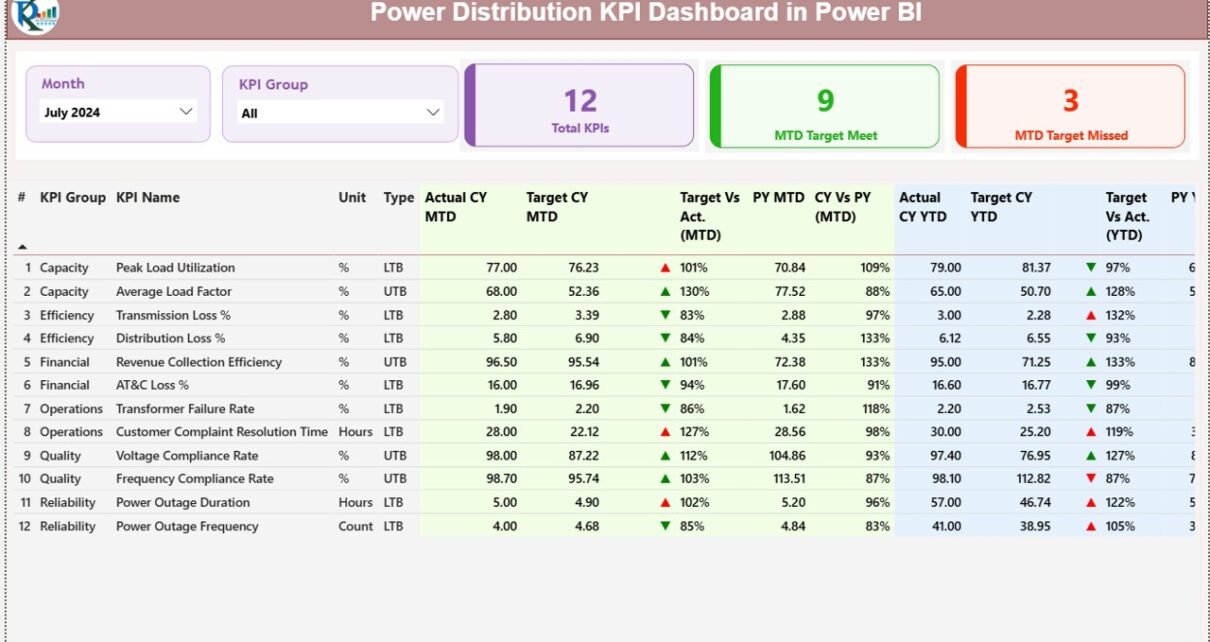
Power Distribution KPI Dashboard in Power BI

December 31, 2025December 31, 2025 PKComments Off on Power Distribution KPI Dashboard in Power BI
Power distribution companies operate in a high-pressure environment. Every day, they must balance reliability, efficiency, safety, and regulatory compliance. Therefore, decision-makers need accurate, timely, and easy-to-understand insights. That is exactly
Read More
Dashboard Power BI

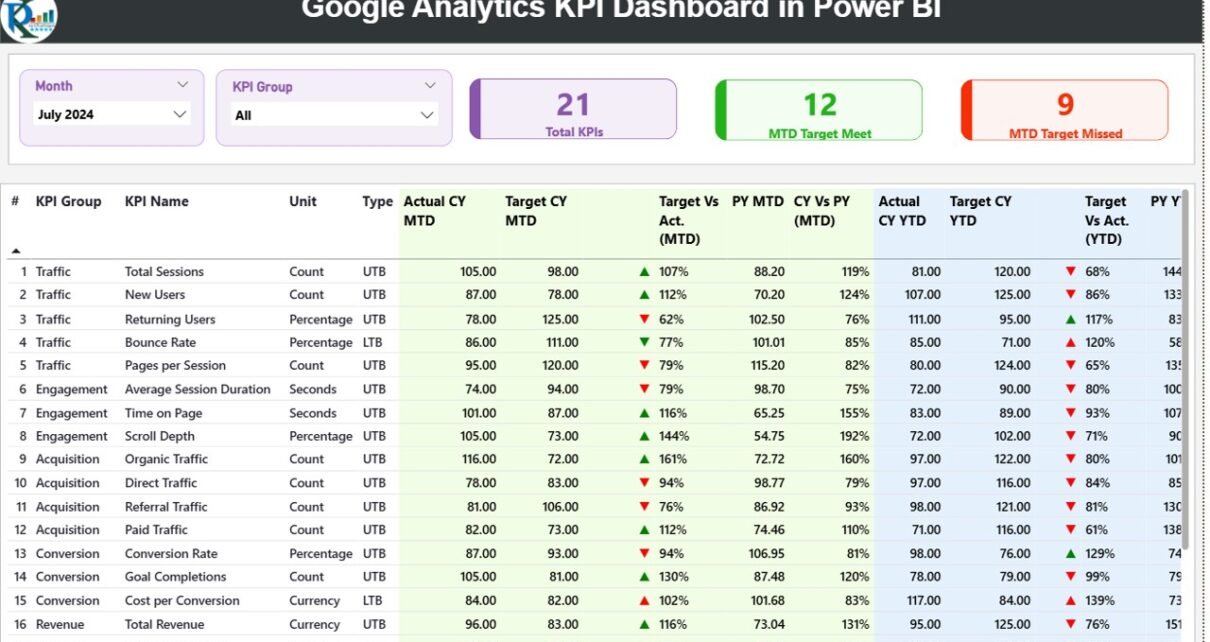
Google Analytics KPI Dashboard in Power BI

December 31, 2025December 31, 2025 PKComments Off on Google Analytics KPI Dashboard in Power BI
Digital marketing decisions demand speed, clarity, and accuracy. However, raw website data alone never tells a complete story. Therefore, businesses need a structured way to track performance, compare targets, and
Read More
Dashboard

Museums & Cultural Centers Dashboard in Power BI

December 30, 2025December 30, 2025 PKComments Off on Museums & Cultural Centers Dashboard in Power BI
Managing museums and cultural centers involves more than preserving history and art. Today, decision-makers must balance visitor experience, operational costs, staffing efficiency, and revenue generation—all at the same time. Because
Read More
Dashboard Power BI

Refinery Procurement KPI Dashboard in Power BI

December 30, 2025December 30, 2025 PKComments Off on Refinery Procurement KPI Dashboard in Power BI
A Refinery Procurement KPI Dashboard in Power BI is a ready-to-use, interactive analytics solution designed to track, measure, and analyze procurement performance inside oil and gas refineries. Instead of managing
Read More
Dashboard Power BI

Smart Cities Tender Dashboard in Power BI

December 29, 2025December 29, 2025 PKComments Off on Smart Cities Tender Dashboard in Power BI
Smart cities rely on efficient planning, transparent governance, and data-driven decision-making to deliver better services to citizens. Among all operational areas, tender management plays a crucial role. Every infrastructure project,
Read More
Dashboard Power BI

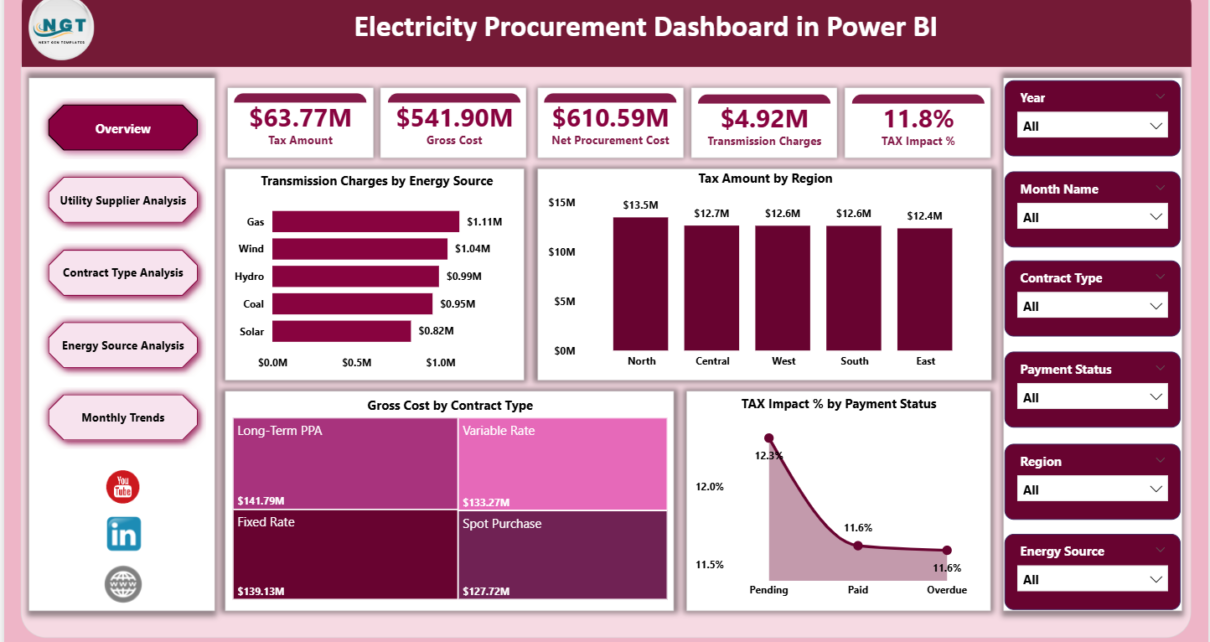
Electricity Procurement Dashboard in Power BI

December 29, 2025December 29, 2025 PKComments Off on Electricity Procurement Dashboard in Power BI
Electricity procurement plays a critical role in controlling operational costs for utilities, manufacturing plants, commercial buildings, and public sector organizations. Every unit of electricity purchased directly impacts budgets, compliance, sustainability
Read More
Dashboard Power BI

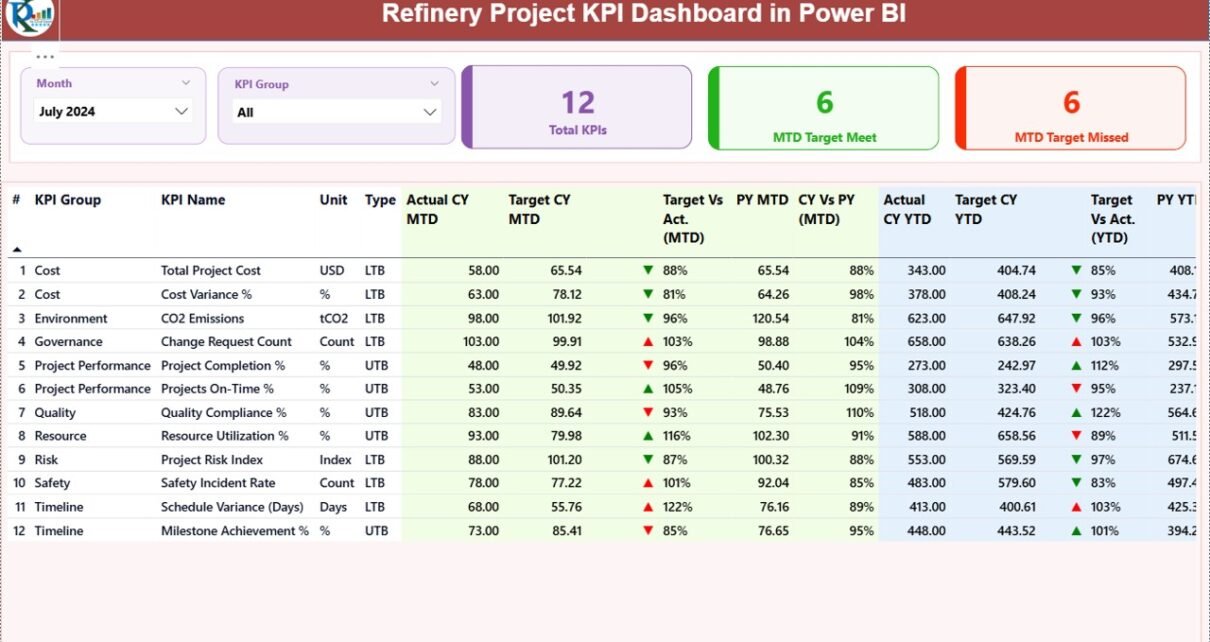
Refinery Project KPI Dashboard in Power BI

December 28, 2025October 10, 2026 PKComments Off on Refinery Project KPI Dashboard in Power BI
Modern refinery projects are complex, capital-intensive, and time-sensitive. Therefore, project managers, engineering teams, and leadership groups must track performance accurately at every stage. However, when teams rely on scattered Excel
Read More
Dashboard Power BI

Smart Cities Purchasing KPI Dashboard in Power BI

December 28, 2025October 10, 2026 PKComments Off on Smart Cities Purchasing KPI Dashboard in Power BI
Smart cities demand speed, transparency, cost efficiency, and accountability in every public purchasing decision. However, managing procurement data across multiple vendors, departments, and projects often creates complexity. Therefore, city administrators
Read More
Dashboard Power BI

Refinery Contract KPI Dashboard in Power BI

December 28, 2025December 28, 2025 PKComments Off on Refinery Contract KPI Dashboard in Power BI
Managing refinery contracts demands accuracy, transparency, and constant performance monitoring. Refineries deal with high-value vendor contracts, strict compliance clauses, penalty conditions, service-level agreements, and long-term commitments. Therefore, decision-makers cannot rely
Read More
Dashboard Power BI

Clinic Tender KPI Dashboard in Power BI

December 28, 2025December 28, 2025 PKComments Off on Clinic Tender KPI Dashboard in Power BI
Managing clinic tenders without structured performance tracking often creates delays, cost overruns, compliance gaps, and poor visibility. However, modern clinics deal with multiple vendors, strict healthcare regulations, budget constraints, and
Read More

Posts pagination

Previous 1 … 44 45 46 … 85 Next
  • Learn Excel (Free Course)
    • 1. Shortcut Keys
    • 2. Fill & Flash Fill
    • 3. Find & Replace
    • 4. Sort & Filter
    • 5. Formulas & Functions
    • 6. Data Validation
    • 7. Conditional Formatting
    • 8. Basic Charts
    • 9. Advanced Charts
    • 10. Pivot Tables
    • 11. Excel Dashboards
    • 12. VBA Course
    • 13. Excel Formulas with AI
  • Templates
  • Tutorials
    • Charts and Visualization
    • VBA
    • Excel Tips and Tricks
    • Excel Dashboards
    • Power Pivot & DAX
  • Power BI
  • Template Store
    • Ready to Use Templates
  • Courses
  • Academy
    • Excel + AI Mastery: 100 Formulas
    • Excel Pivot Tables & Dashboards
  • About Us
  • Contact Us
Copyright © 2023 PK-AnExcelExpert.com - Privacy Policy