New: NextGenTemplates Academy - video courses on Excel formulas with AI and Pivot Tables & dashboards. Early-bird: 20% off with code EARLYBIRD20 - first 20 orders only. See the courses →
  • Learn Excel (Free Course)
    • 1. Shortcut Keys
    • 2. Fill & Flash Fill
    • 3. Find & Replace
    • 4. Sort & Filter
    • 5. Formulas & Functions
    • 6. Data Validation
    • 7. Conditional Formatting
    • 8. Basic Charts
    • 9. Advanced Charts
    • 10. Pivot Tables
    • 11. Excel Dashboards
    • 12. VBA Course
    • 13. Excel Formulas with AI
  • Templates
  • Tutorials
    • Charts and Visualization
    • VBA
    • Excel Tips and Tricks
    • Excel Dashboards
    • Power Pivot & DAX
  • Power BI
  • Template Store
    • Ready to Use Templates
  • Courses
  • Academy
    • Excel + AI Mastery: 100 Formulas
    • Excel Pivot Tables & Dashboards
  • About Us
  • Contact Us

PK: An Excel Expert

Transforming Data into Decisions

Tag: Power BI dashboard

Power BI

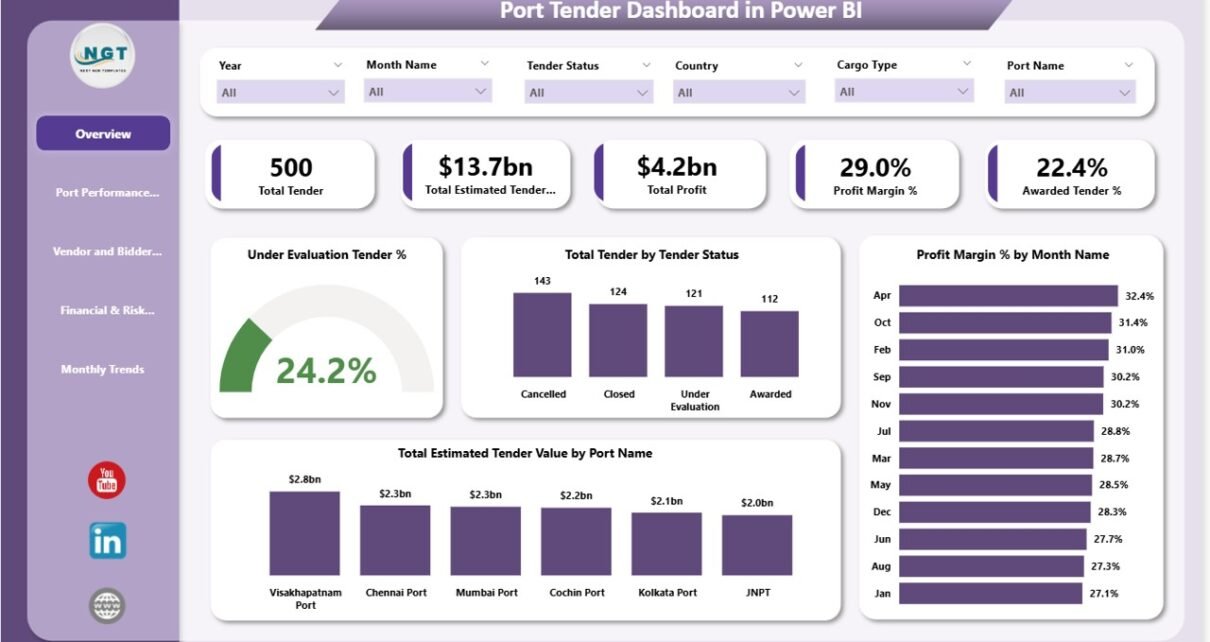
Port Tender Dashboard in Power BI

December 23, 2025December 23, 2025 PKComments Off on Port Tender Dashboard in Power BI
Port authorities, logistics companies, and infrastructure contractors handle complex tender processes every year. These tenders involve large contract values, multiple bidders, varying cargo types, long bid cycles, and significant financial
Read More
Dashboard Power BI

Clinic Contract Management Dashboard in Power BI

December 23, 2025December 23, 2025 PKComments Off on Clinic Contract Management Dashboard in Power BI
Managing clinic contracts efficiently remains a constant challenge for healthcare organizations. Clinics handle multiple contracts related to medical equipment, laboratory services, facility maintenance, IT systems, outsourced staff, and vendor partnerships.
Read More
Dashboard Power BI

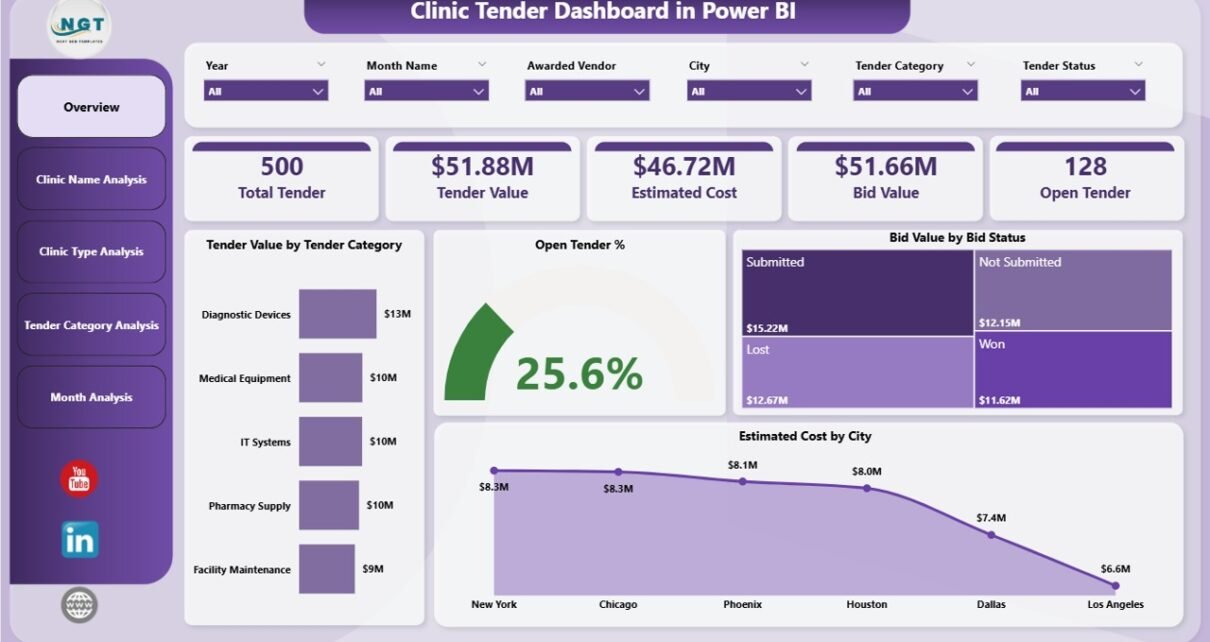
Clinic Tender Dashboard in Power BI

December 23, 2025December 23, 2025 PKComments Off on Clinic Tender Dashboard in Power BI
Managing tenders in a clinic environment requires accuracy, speed, and full visibility. Clinics deal with multiple tenders related to medical equipment, pharmaceuticals, IT systems, facility management, and outsourced services. However,
Read More
Dashboard Power BI

Electricity Tender Dashboard in Power BI

December 23, 2025December 23, 2025 PKComments Off on Electricity Tender Dashboard in Power BI
Managing electricity tenders demands accuracy, speed, and transparency. However, many organizations still depend on scattered Excel files, manual summaries, and static reports. As a result, decision-making becomes slow, errors increase,
Read More
Dashboard Power BI

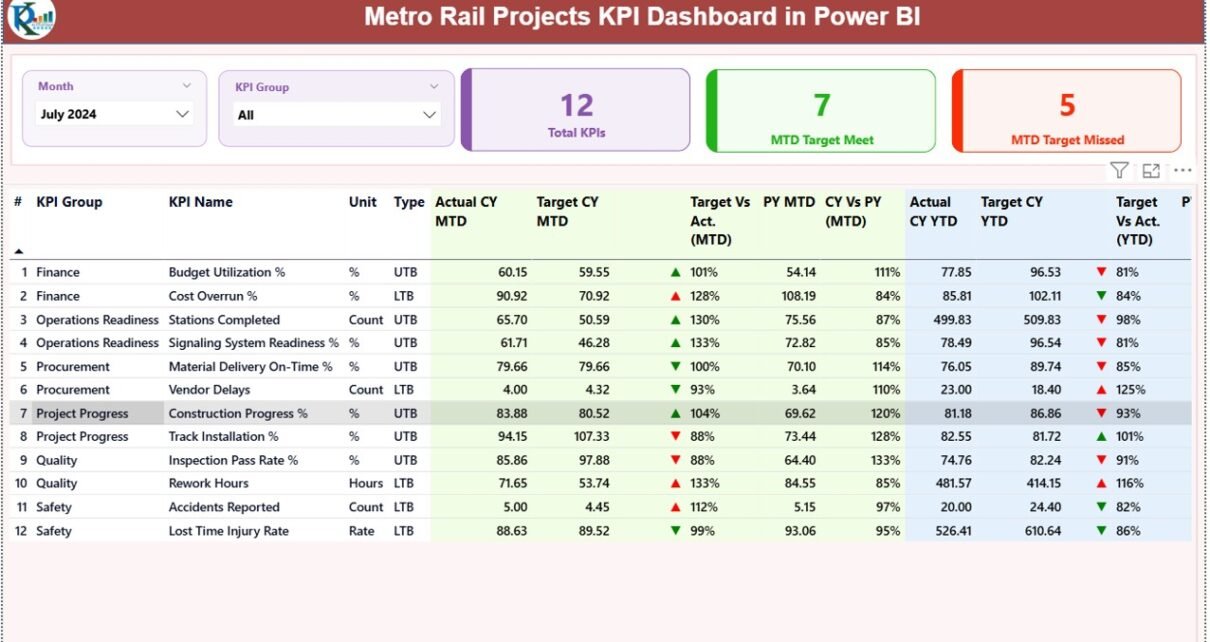
Metro Rail Projects KPI Dashboard in Power BI

December 23, 2025December 23, 2025 PKComments Off on Metro Rail Projects KPI Dashboard in Power BI
Metro rail projects involve massive investments, tight timelines, public accountability, and strict performance expectations. Therefore, project authorities must track progress, cost, quality, and efficiency continuously. However, when data stays scattered
Read More
Dashboard Power BI

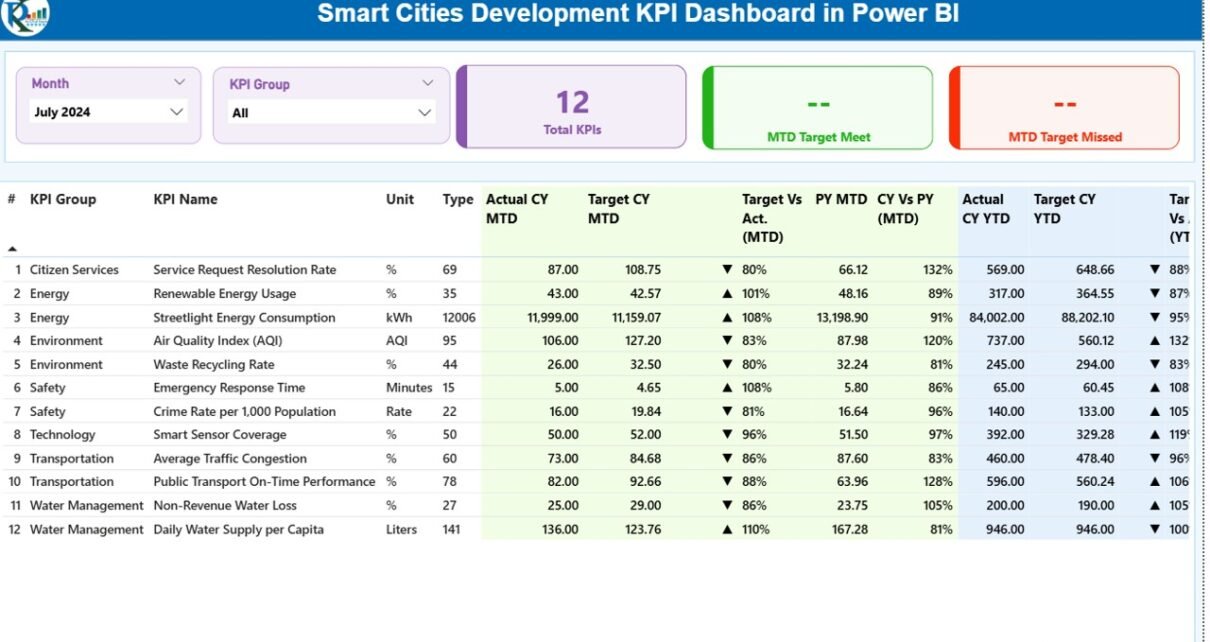
Smart Cities Development KPI Dashboard in Power BI

December 22, 2025December 22, 2025 PKComments Off on Smart Cities Development KPI Dashboard in Power BI
Smart cities continue to reshape how governments plan, build, and manage urban ecosystems. Cities now depend on data to improve infrastructure, enhance citizen services, optimize resources, and ensure sustainable growth.
Read More
Dashboard Power BI

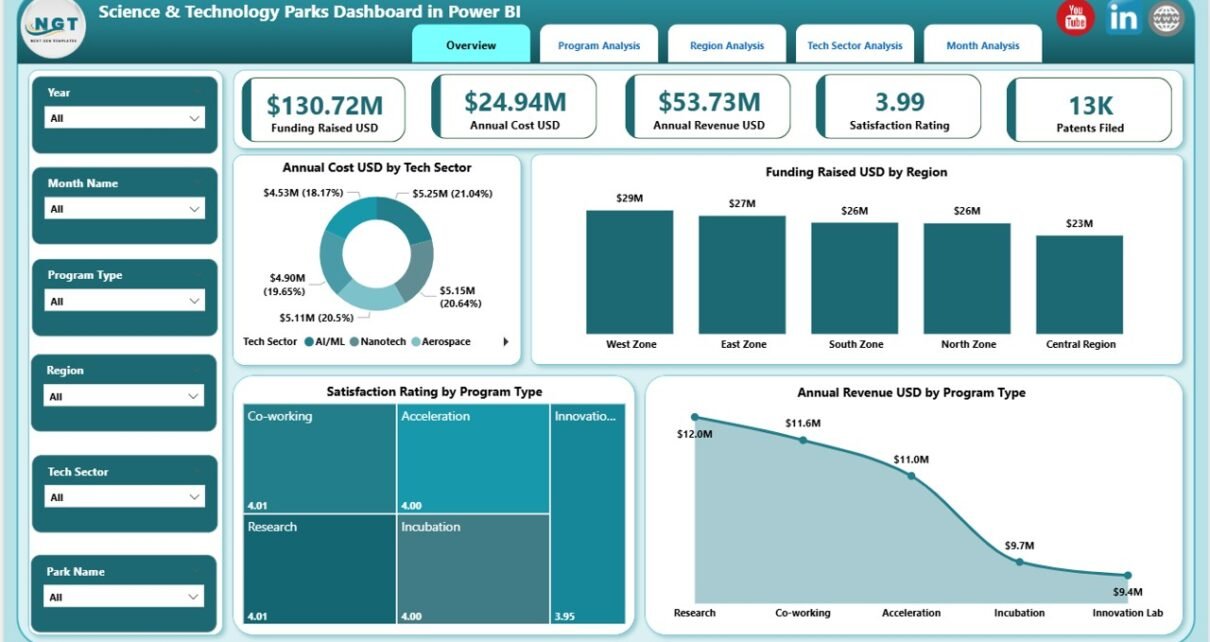
Science & Technology Parks Dashboard in Power BI

December 22, 2025December 22, 2025 PKComments Off on Science & Technology Parks Dashboard in Power BI
Science and technology parks play a vital role in innovation ecosystems. They connect startups, research institutions, universities, investors, and government bodies under one structured environment. However, managing such complex ecosystems
Read More
Dashboard Power BI

Research & Development Institutes Dashboard in Power BI

December 22, 2025December 22, 2025 PKComments Off on Research & Development Institutes Dashboard in Power BI
Research and Development (R&D) institutes drive innovation, scientific discovery, and long-term growth. However, without clear performance visibility, even the best research initiatives lose direction. Therefore, leaders must track projects, budgets,
Read More
Dashboard Power BI

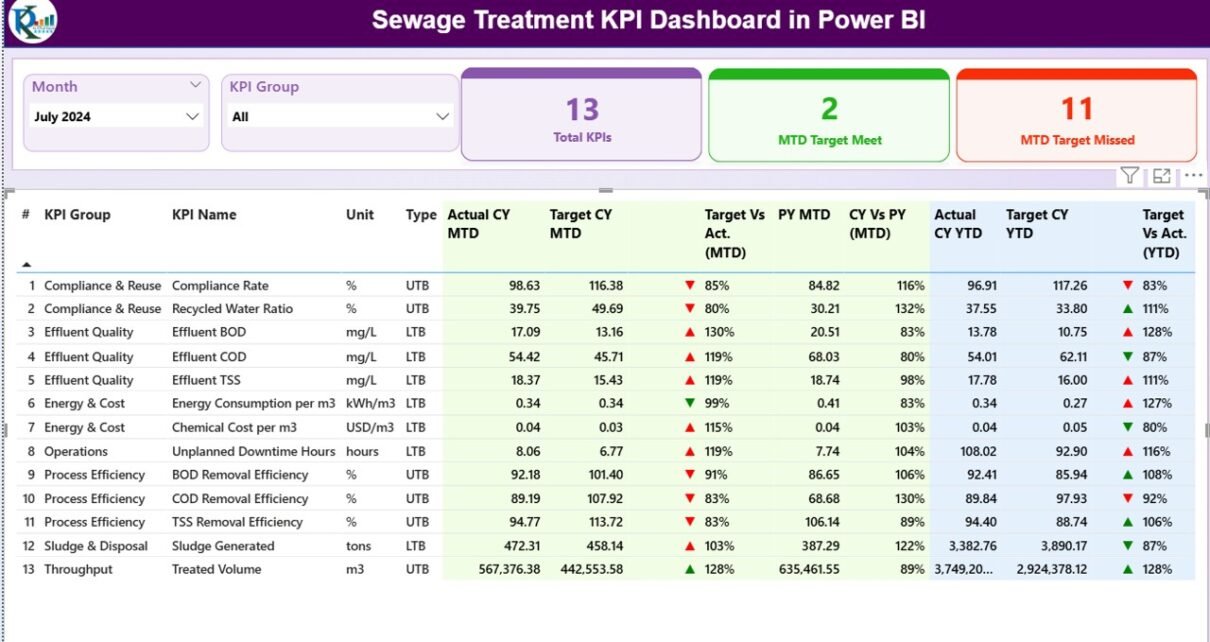
Sewage Treatment KPI Dashboard in Power BI

December 22, 2025December 22, 2025 PKComments Off on Sewage Treatment KPI Dashboard in Power BI
Sewage treatment plants play a critical role in protecting public health, preserving water resources, and ensuring environmental compliance. However, managing a sewage treatment facility without clear performance visibility creates delays,
Read More
Dashboard Power BI

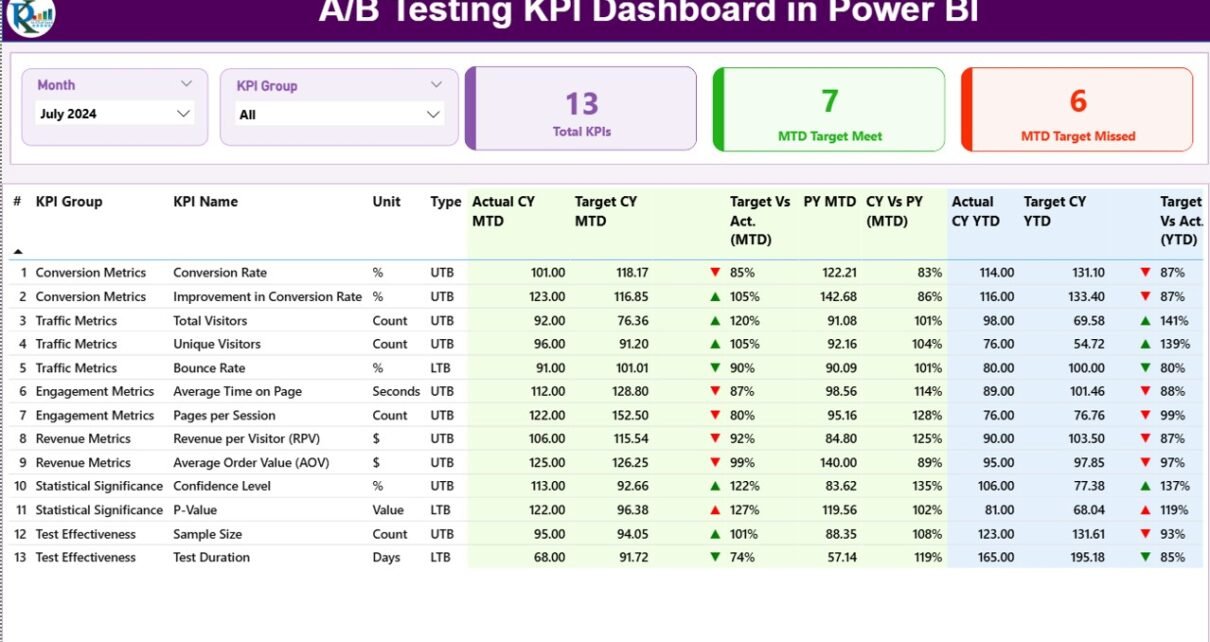
A/B Testing KPI Dashboard in Power BI

December 22, 2025December 22, 2025 PKComments Off on A/B Testing KPI Dashboard in Power BI
A/B testing sits at the heart of modern digital decision-making. Whether you optimize websites, mobile apps, email campaigns, pricing strategies, or product features, you rely on experiments to prove what
Read More

Posts pagination

Previous 1 … 48 49 50 … 85 Next
  • Learn Excel (Free Course)
    • 1. Shortcut Keys
    • 2. Fill & Flash Fill
    • 3. Find & Replace
    • 4. Sort & Filter
    • 5. Formulas & Functions
    • 6. Data Validation
    • 7. Conditional Formatting
    • 8. Basic Charts
    • 9. Advanced Charts
    • 10. Pivot Tables
    • 11. Excel Dashboards
    • 12. VBA Course
    • 13. Excel Formulas with AI
  • Templates
  • Tutorials
    • Charts and Visualization
    • VBA
    • Excel Tips and Tricks
    • Excel Dashboards
    • Power Pivot & DAX
  • Power BI
  • Template Store
    • Ready to Use Templates
  • Courses
  • Academy
    • Excel + AI Mastery: 100 Formulas
    • Excel Pivot Tables & Dashboards
  • About Us
  • Contact Us
Copyright © 2023 PK-AnExcelExpert.com - Privacy Policy