New: NextGenTemplates Academy - video courses on Excel formulas with AI and Pivot Tables & dashboards. Early-bird: 20% off with code EARLYBIRD20 - first 20 orders only. See the courses →
  • Learn Excel (Free Course)
    • 1. Shortcut Keys
    • 2. Fill & Flash Fill
    • 3. Find & Replace
    • 4. Sort & Filter
    • 5. Formulas & Functions
    • 6. Data Validation
    • 7. Conditional Formatting
    • 8. Basic Charts
    • 9. Advanced Charts
    • 10. Pivot Tables
    • 11. Excel Dashboards
    • 12. VBA Course
    • 13. Excel Formulas with AI
  • Templates
  • Tutorials
    • Charts and Visualization
    • VBA
    • Excel Tips and Tricks
    • Excel Dashboards
    • Power Pivot & DAX
  • Power BI
  • Template Store
    • Ready to Use Templates
  • Courses
  • Academy
    • Excel + AI Mastery: 100 Formulas
    • Excel Pivot Tables & Dashboards
  • About Us
  • Contact Us

PK: An Excel Expert

Transforming Data into Decisions
Tag: Power BI dashboard

Dashboard Power BI

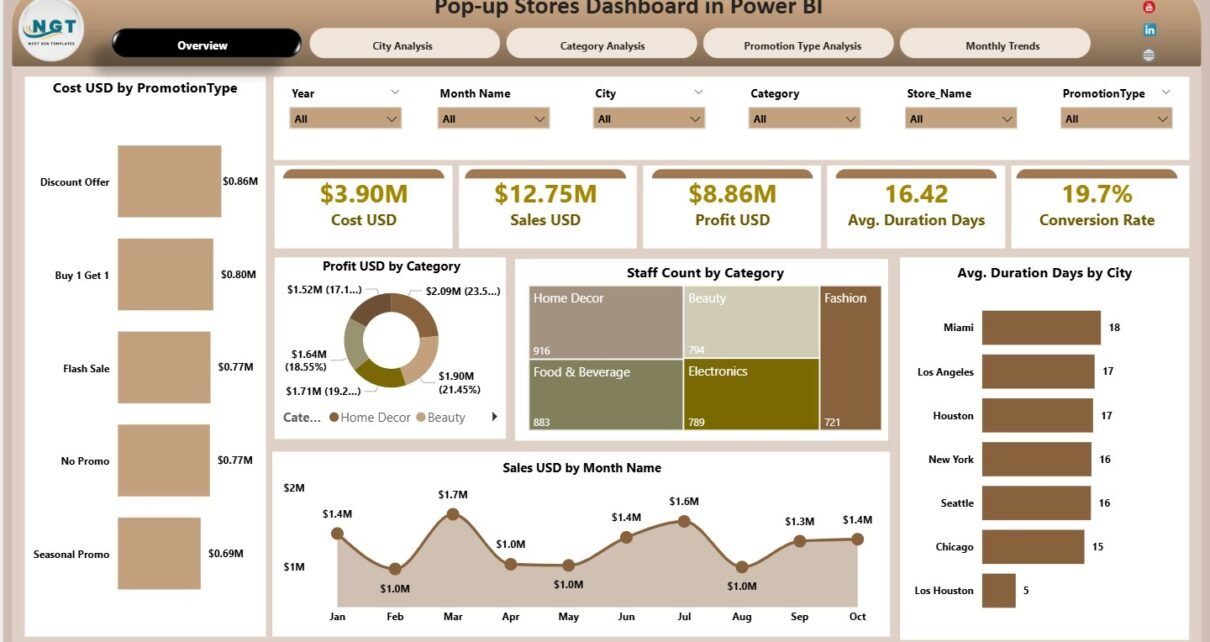
Pop-up Stores Dashboard in Power BI

December 16, 2025December 16, 2025 PKComments Off on Pop-up Stores Dashboard in Power BI
Pop-up stores have become a powerful retail strategy for brands that want flexibility, fast market entry, and high customer engagement. However, because pop-up stores operate for a limited time, performance
Read More
Dashboard Power BI

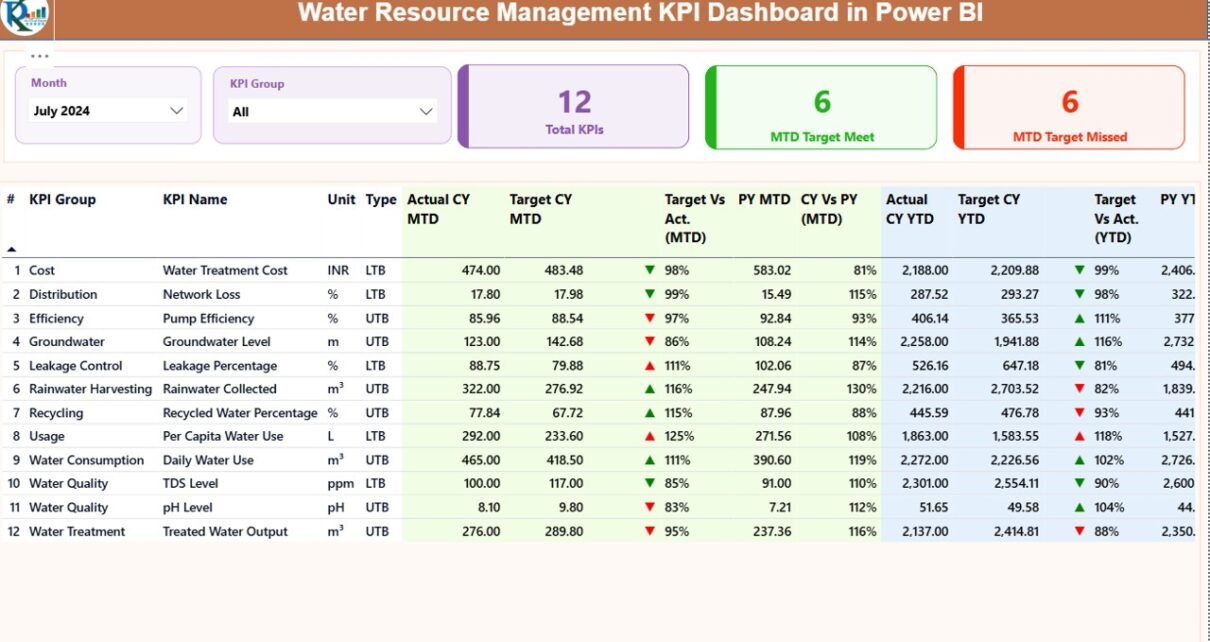
Water Resource Management KPI Dashboard in Power BI

December 16, 2025December 16, 2025 PKComments Off on Water Resource Management KPI Dashboard in Power BI
Water resource management plays a critical role in sustainability, operational efficiency, and regulatory compliance. However, many organizations still track water usage, losses, efficiency, and targets using scattered Excel files or
Read More
Dashboard Power BI

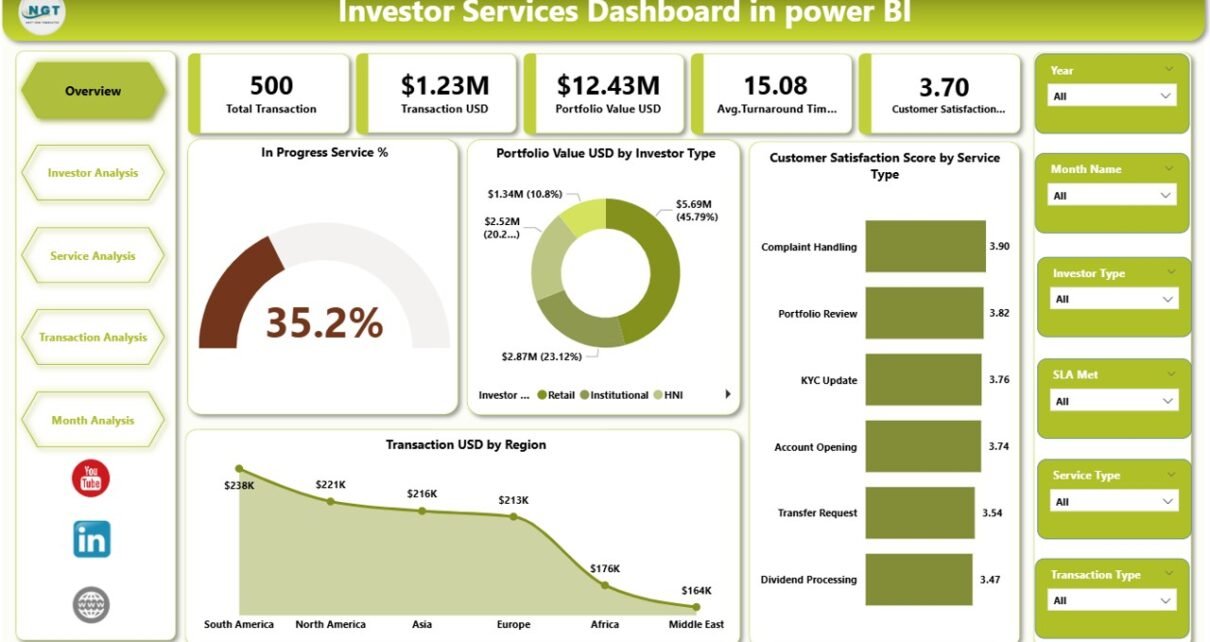
Investor Services Dashboard in power BI

December 16, 2025December 16, 2025 PKComments Off on Investor Services Dashboard in power BI
Managing investor services without a centralized performance view often leads to delayed decisions, missed opportunities, and dissatisfied investors. However, when organizations adopt an Investor Services Dashboard in Power BI, they
Read More
Dashboard Power BI

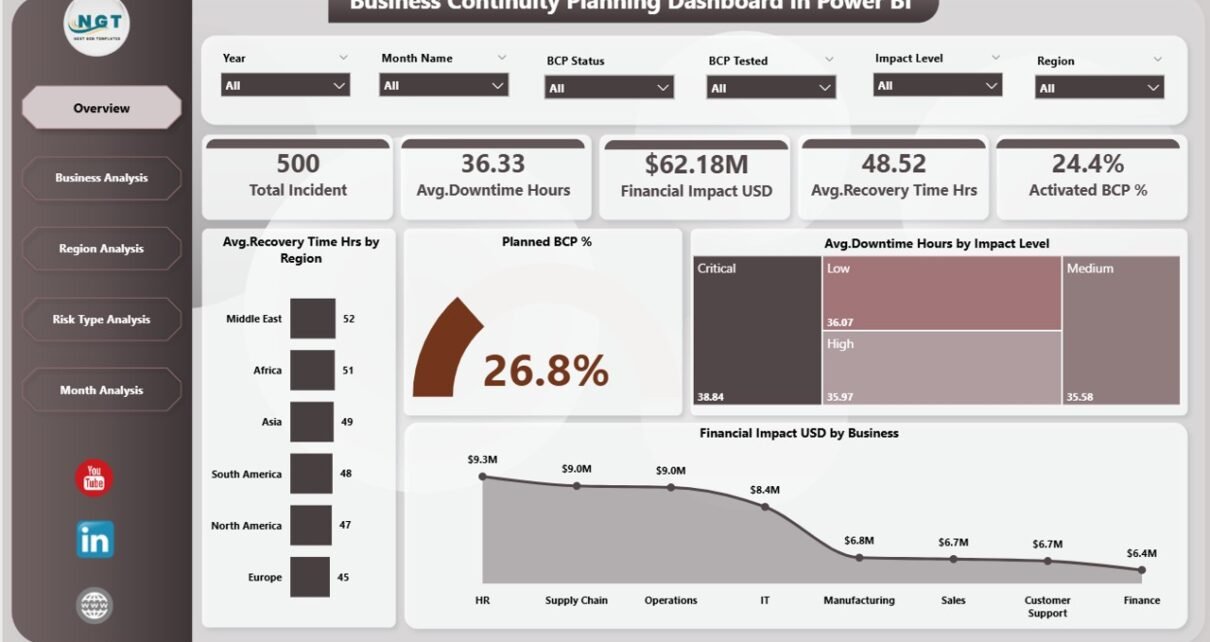
Business Continuity Planning Dashboard in Power BI

December 16, 2025December 16, 2025 PKComments Off on Business Continuity Planning Dashboard in Power BI
In today’s unpredictable business environment, disruptions can happen at any time. Natural disasters, cyberattacks, system failures, supply chain breakdowns, or even regional shutdowns can stop operations instantly. Therefore, organizations must
Read More
Dashboard Power BI

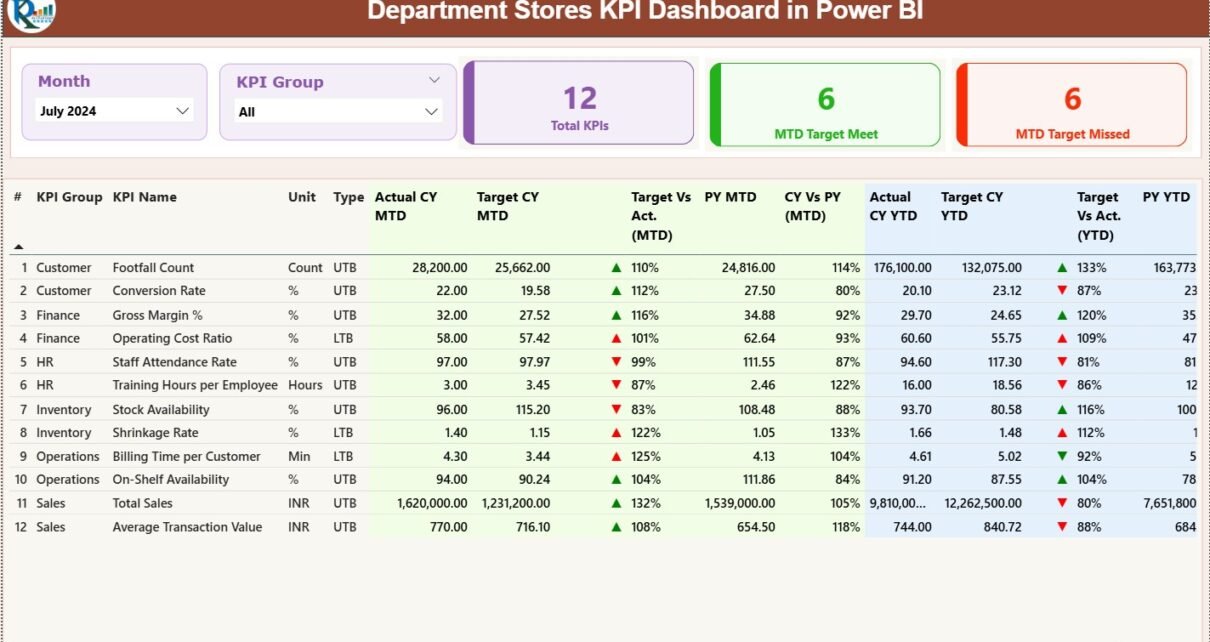
Department Stores KPI Dashboard in Power BI

December 16, 2025December 16, 2025 PKComments Off on Department Stores KPI Dashboard in Power BI
Running a department store today involves much more than stocking products and managing sales counters. Store managers must track sales growth, customer behavior, operational efficiency, inventory performance, and staff productivity
Read More
Dashboard Power BI

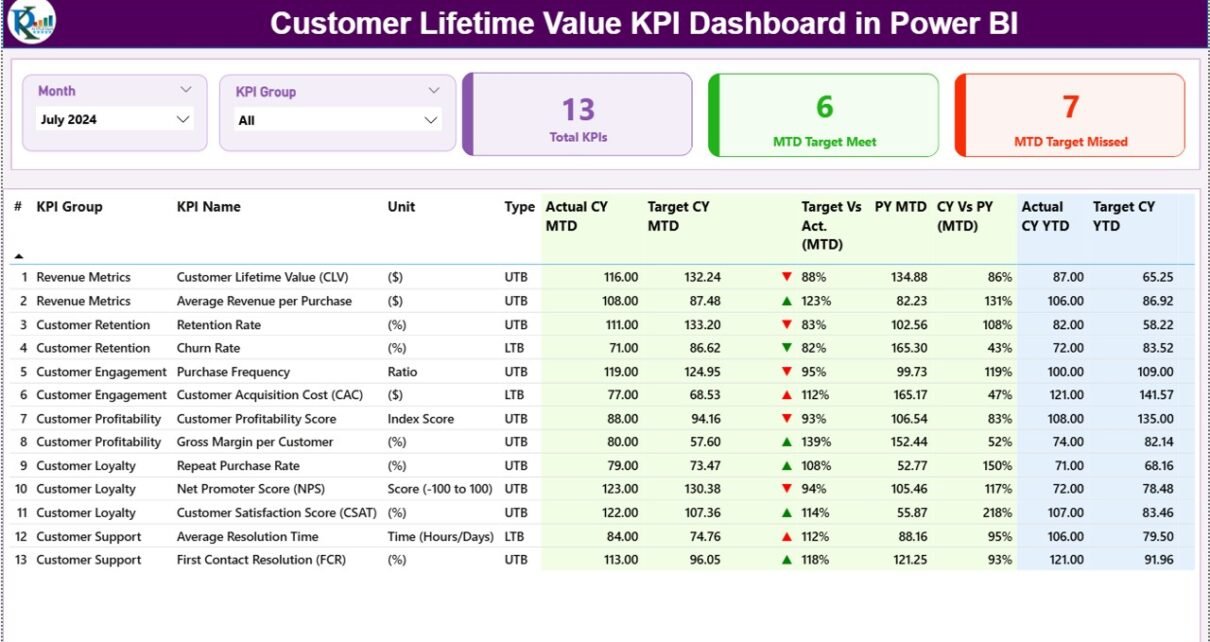
Customer Lifetime Value KPI Dashboard in Power BI

December 16, 2025December 16, 2025 PKComments Off on Customer Lifetime Value KPI Dashboard in Power BI
Managing customers is no longer just about acquiring new leads. Instead, modern businesses focus on maximizing the long-term value of each customer. Therefore, organizations need a clear, data-driven way to
Read More
Dashboard Power BI

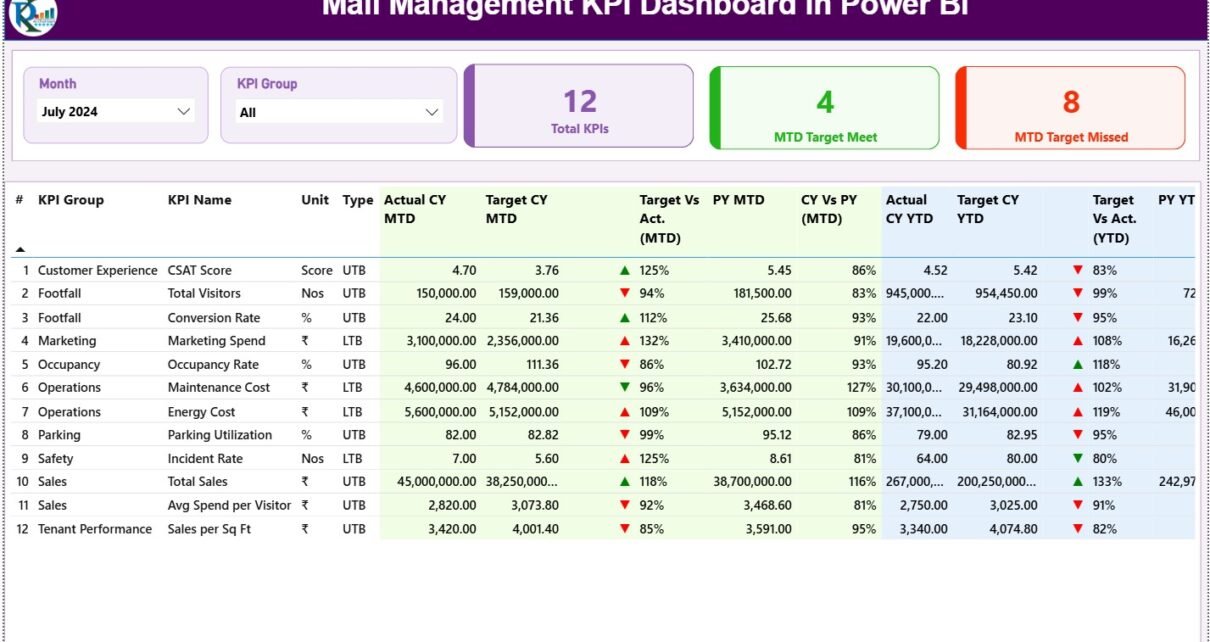
Mall Management KPI Dashboard in Power BI

December 16, 2025December 16, 2025 PKComments Off on Mall Management KPI Dashboard in Power BI
Managing a shopping mall today requires much more than leasing spaces and collecting rent. Mall managers must constantly track footfall, revenue performance, operational efficiency, tenant success, and customer experience. However,
Read More
Dashboard Power BI

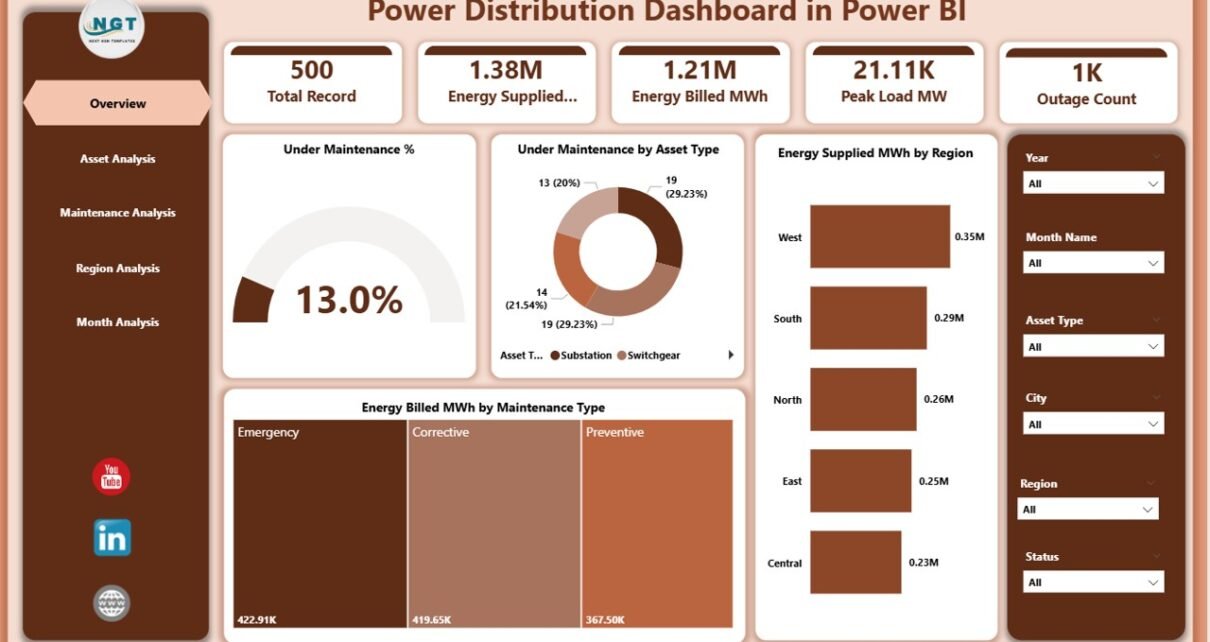
Power Distribution Dashboard in Power BI

December 15, 2025December 15, 2025 PKComments Off on Power Distribution Dashboard in Power BI
Power distribution companies operate in a complex and data-intensive environment. Every day, they manage assets, monitor energy flow, track maintenance activities, handle outages, and ensure reliable electricity delivery. However, when
Read More
Power BI

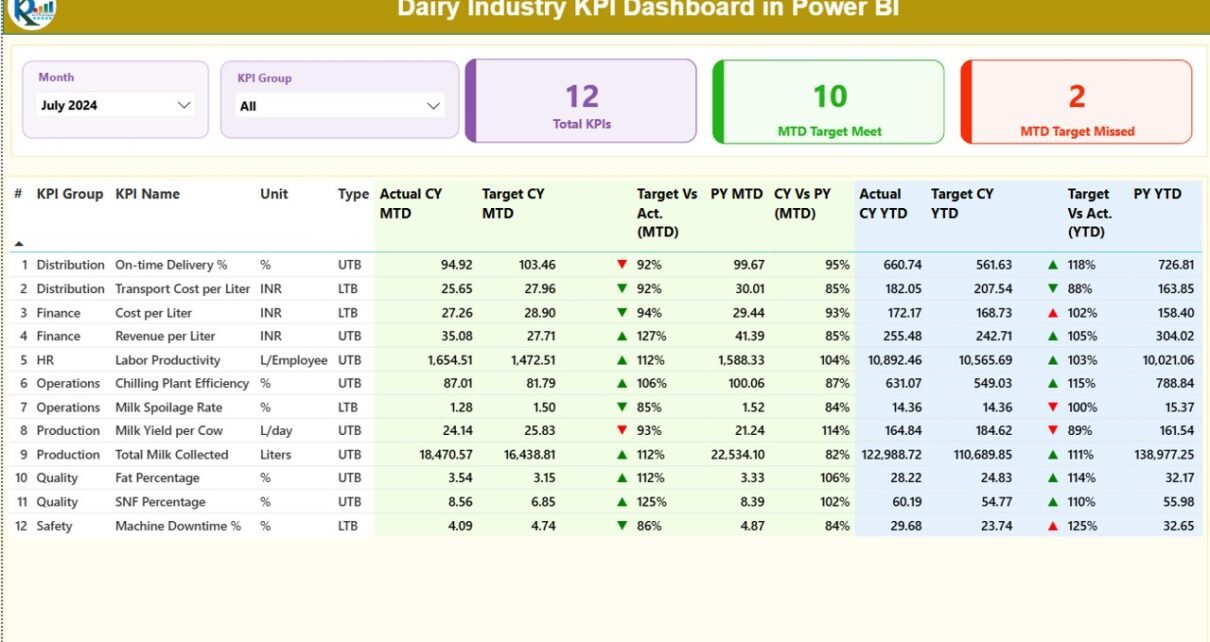
Dairy Industry KPI Dashboard in Power BI

December 15, 2025December 15, 2025 PKComments Off on Dairy Industry KPI Dashboard in Power BI
The dairy industry operates in a highly competitive, regulated, and cost-sensitive environment. Therefore, dairy companies must monitor production efficiency, quality, costs, sales, and profitability continuously. However, when data stays scattered
Read More
Dashboard Power BI

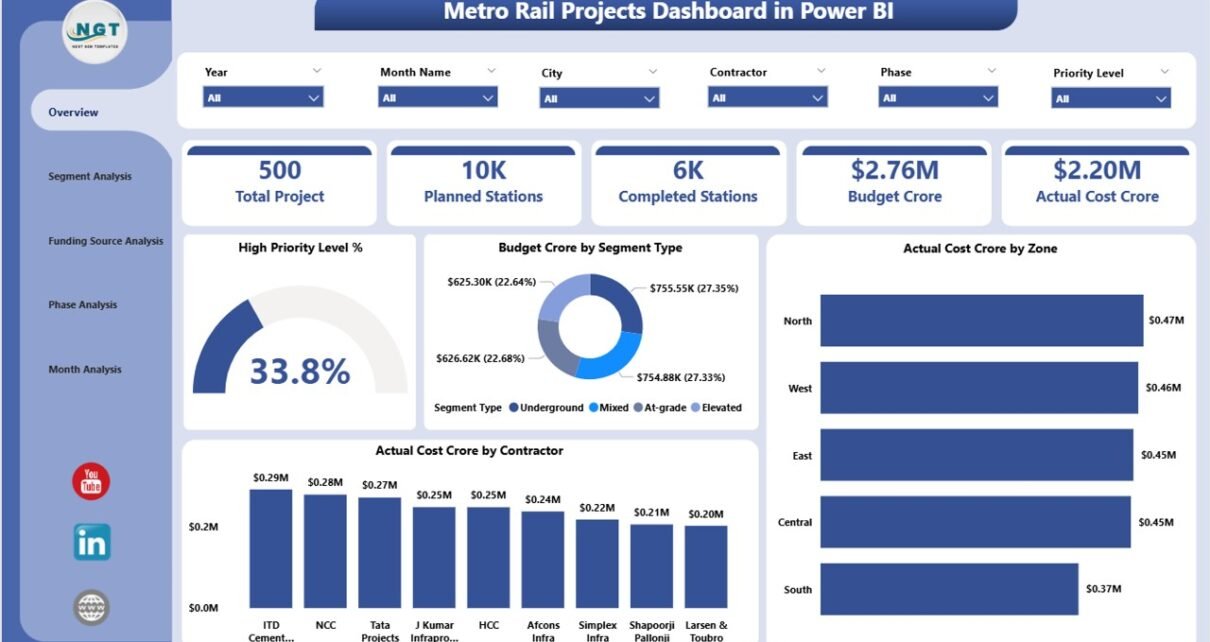
Metro Rail Projects Dashboard in Power BI

December 15, 2025December 15, 2025 PKComments Off on Metro Rail Projects Dashboard in Power BI
Urban transportation systems continue to expand rapidly. As cities grow, metro rail projects play a crucial role in reducing congestion, lowering pollution, and improving mobility. However, metro rail projects involve
Read More

Posts pagination

Previous 1 … 51 52 53 … 85 Next
  • Learn Excel (Free Course)
    • 1. Shortcut Keys
    • 2. Fill & Flash Fill
    • 3. Find & Replace
    • 4. Sort & Filter
    • 5. Formulas & Functions
    • 6. Data Validation
    • 7. Conditional Formatting
    • 8. Basic Charts
    • 9. Advanced Charts
    • 10. Pivot Tables
    • 11. Excel Dashboards
    • 12. VBA Course
    • 13. Excel Formulas with AI
  • Templates
  • Tutorials
    • Charts and Visualization
    • VBA
    • Excel Tips and Tricks
    • Excel Dashboards
    • Power Pivot & DAX
  • Power BI
  • Template Store
    • Ready to Use Templates
  • Courses
  • Academy
    • Excel + AI Mastery: 100 Formulas
    • Excel Pivot Tables & Dashboards
  • About Us
  • Contact Us
Copyright © 2023 PK-AnExcelExpert.com - Privacy Policy