New: NextGenTemplates Academy - video courses on Excel formulas with AI and Pivot Tables & dashboards. Early-bird: 20% off with code EARLYBIRD20 - first 20 orders only. See the courses →
  • Learn Excel (Free Course)
    • 1. Shortcut Keys
    • 2. Fill & Flash Fill
    • 3. Find & Replace
    • 4. Sort & Filter
    • 5. Formulas & Functions
    • 6. Data Validation
    • 7. Conditional Formatting
    • 8. Basic Charts
    • 9. Advanced Charts
    • 10. Pivot Tables
    • 11. Excel Dashboards
    • 12. VBA Course
    • 13. Excel Formulas with AI
  • Templates
  • Tutorials
    • Charts and Visualization
    • VBA
    • Excel Tips and Tricks
    • Excel Dashboards
    • Power Pivot & DAX
  • Power BI
  • Template Store
    • Ready to Use Templates
  • Courses
  • Academy
    • Excel + AI Mastery: 100 Formulas
    • Excel Pivot Tables & Dashboards
  • About Us
  • Contact Us

PK: An Excel Expert

Transforming Data into Decisions

Tag: Power BI dashboard

Dashboard Power BI

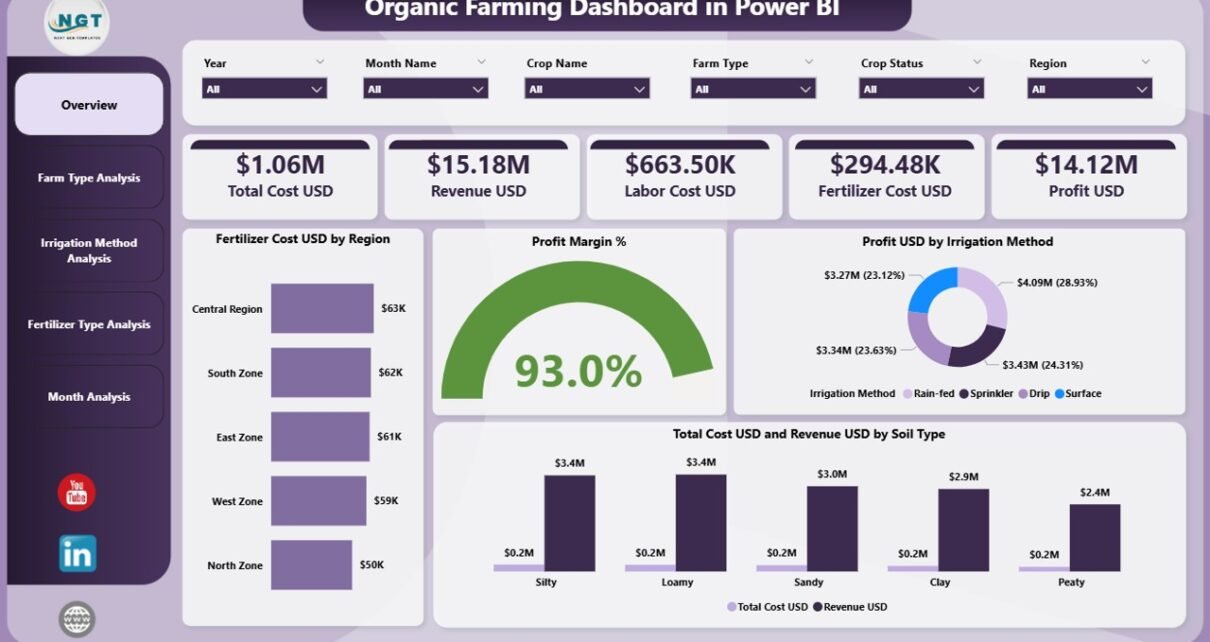
Organic Farming Dashboard in Power BI

December 6, 2025December 6, 2025 PKComments Off on Organic Farming Dashboard in Power BI
Organic farming continues to grow rapidly across the world. Farmers, agribusiness owners, and policymakers now focus not only on yield but also on sustainability, cost control, and profitability. However, managing
Read More
Dashboard Power BI

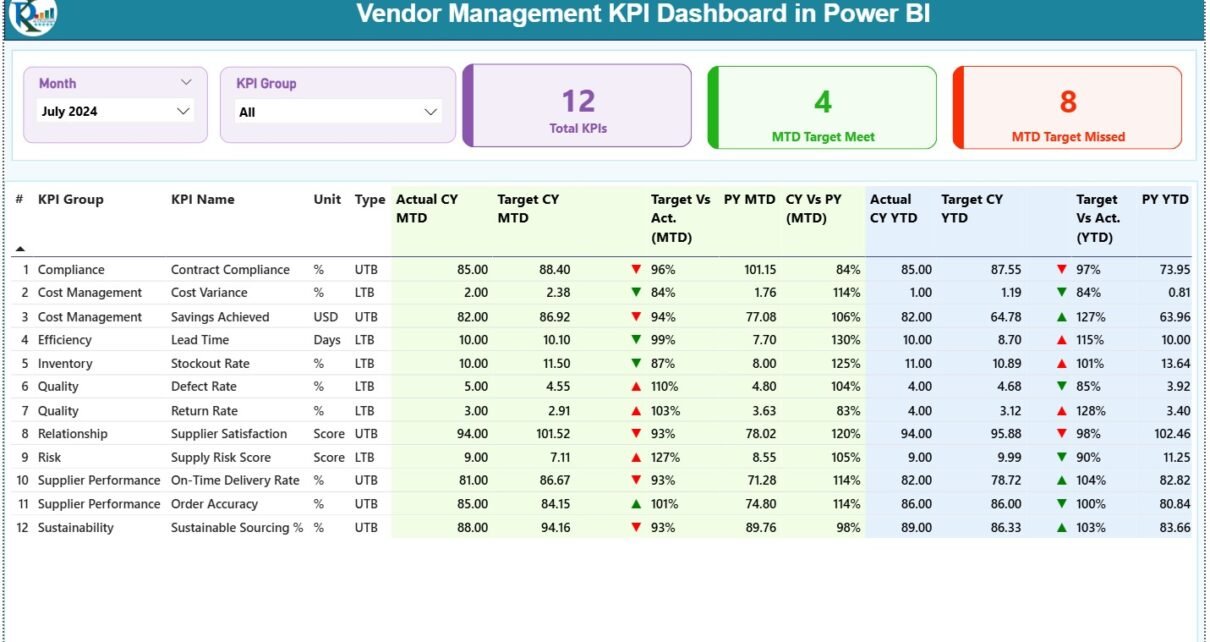
Vendor Management KPI Dashboard in Power BI

December 6, 2025December 6, 2025 PKComments Off on Vendor Management KPI Dashboard in Power BI
Vendor relationships play a critical role in business success. Every organization depends on vendors for quality, cost control, delivery timelines, and service stability. However, many teams still track vendor performance
Read More
Dashboard Power BI

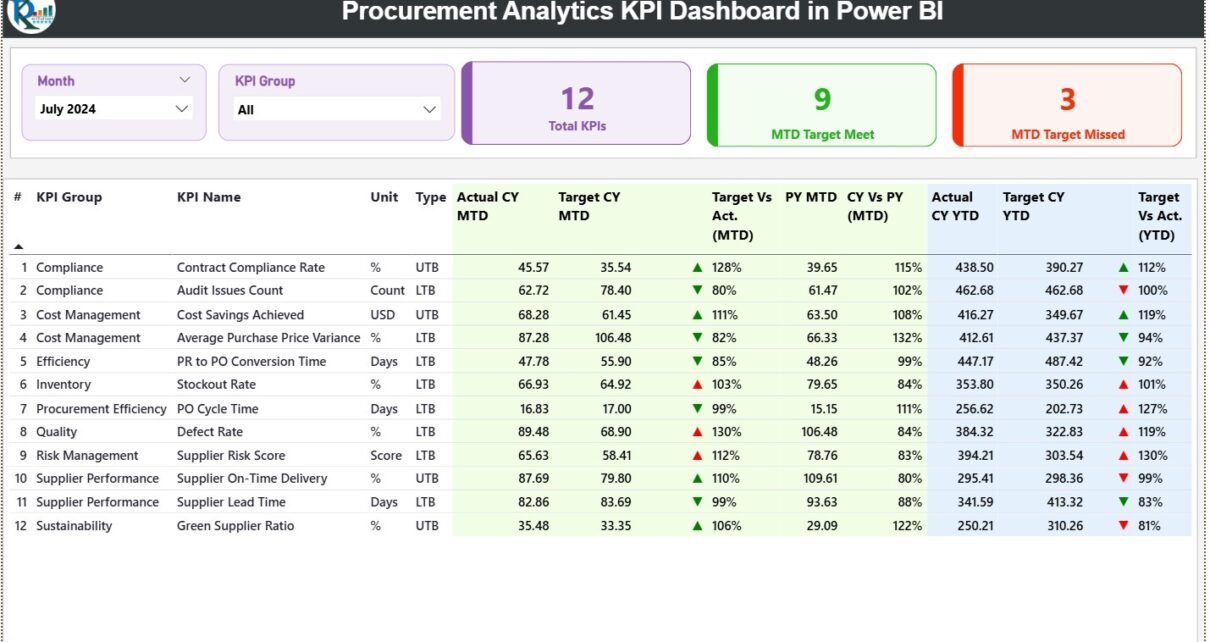
Procurement Analytics KPI Dashboard in Power BI

December 6, 2025December 6, 2025 PKComments Off on Procurement Analytics KPI Dashboard in Power BI
Procurement teams handle one of the most critical business functions—managing costs, vendors, contracts, delivery timelines, and compliance. However, procurement data often stays scattered across spreadsheets, emails, and systems. Procurement Analytics
Read More
Dashboard Power BI

Fashion E-commerce Dashboard in Power BI

December 5, 2025December 5, 2025 PKComments Off on Fashion E-commerce Dashboard in Power BI
The fashion e-commerce industry grows every day, and competition becomes stronger with every new trend. Customers expect fast delivery, accurate recommendations, transparent pricing, attractive discounts, and an enjoyable online shopping
Read More
Power BI

Special Education KPI Dashboard in Power BI

December 5, 2025December 5, 2025 PKComments Off on Special Education KPI Dashboard in Power BI
Special education teams work hard to support diverse learners, yet they often struggle to understand performance trends because their data stays scattered across reports, spreadsheets, and manual trackers. Teachers, coordinators,
Read More
Dashboard Power BI

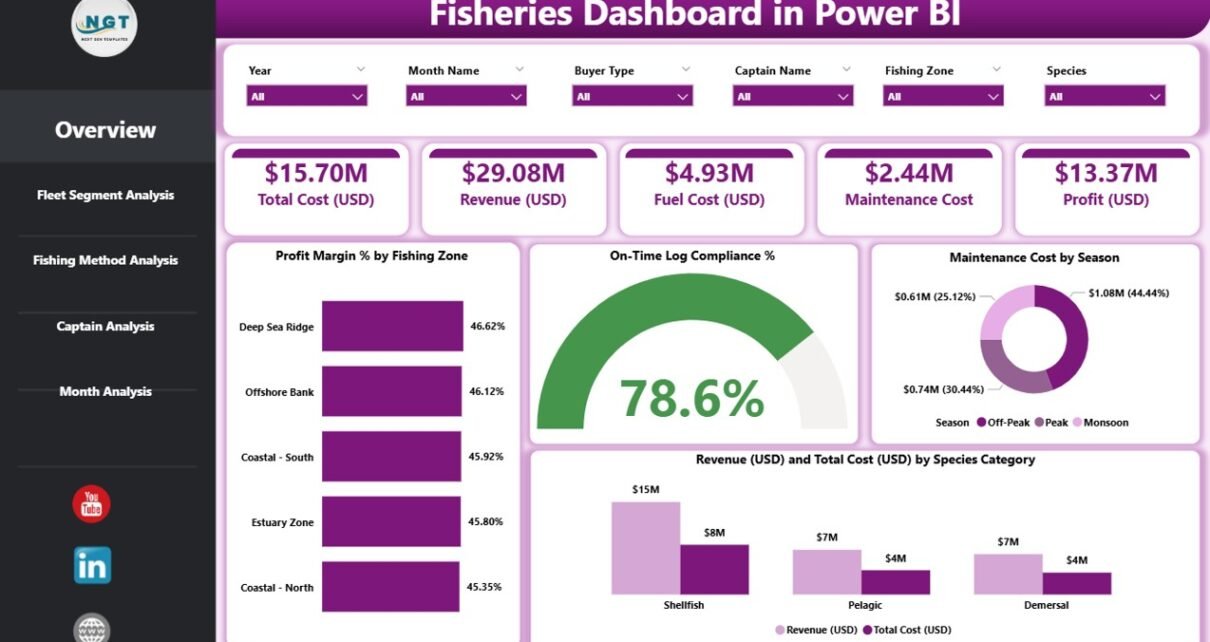
Fisheries Dashboard in Power BI

December 5, 2025December 5, 2025 PKComments Off on Fisheries Dashboard in Power BI
The fishing industry continues to grow because global demand for seafood increases every year. At the same time, fisheries face new challenges such as rising fuel prices, unpredictable marine conditions,
Read More
Dashboard Power BI

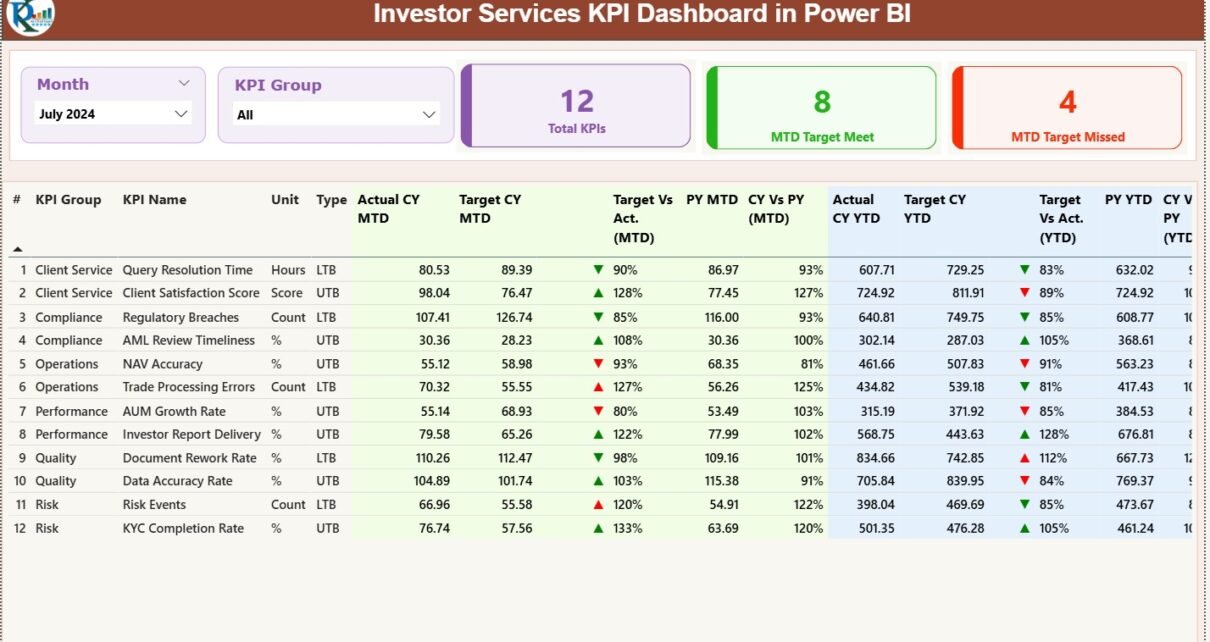
Investor Services KPI Dashboard in Power BI

December 5, 2025December 5, 2025 PKComments Off on Investor Services KPI Dashboard in Power BI
Investor services teams work in a fast and demanding environment. They handle investor onboarding, communication, fund reporting, compliance reviews, performance updates, and service-level commitments every day. Because investors expect transparency
Read More
Dashboard Power BI

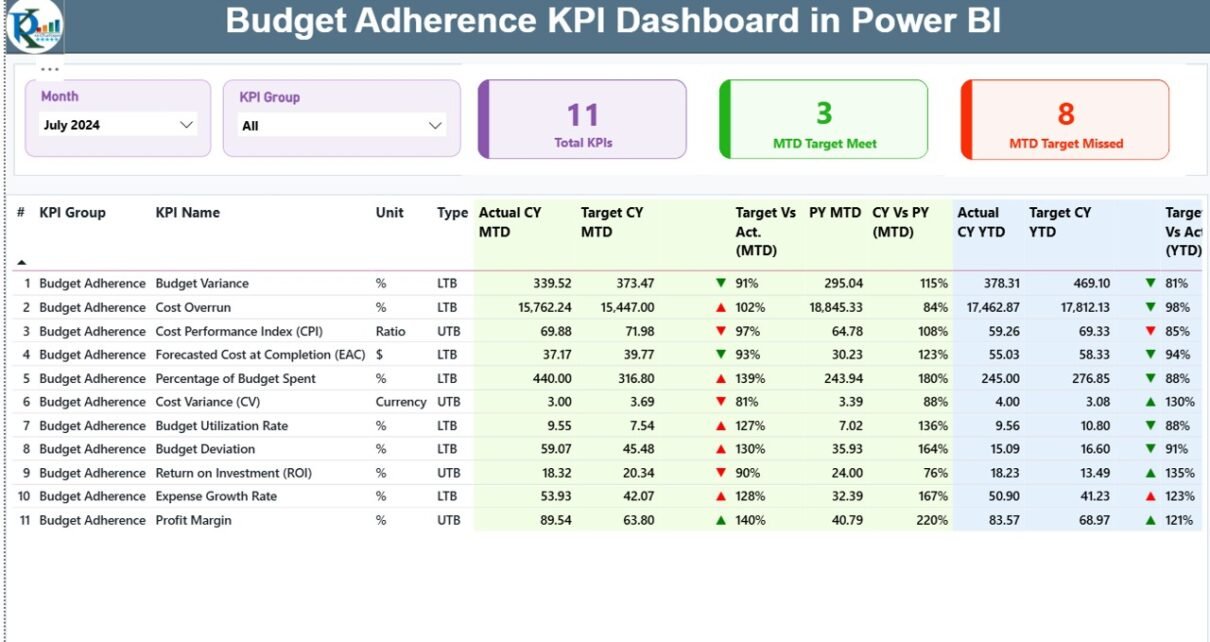
Budget Adherence KPI Dashboard in Power BI

December 5, 2025December 5, 2025 PKComments Off on Budget Adherence KPI Dashboard in Power BI
Every organization wants to work within its budget. Yet, financial teams struggle because numbers often stay scattered across spreadsheets, emails, and outdated reports. When leaders cannot see real-time budget performance,
Read More
Dashboard Power BI

Renewable Infrastructure Projects KPI Dashboard in Power BI

December 5, 2025December 5, 2025 PKComments Off on Renewable Infrastructure Projects KPI Dashboard in Power BI
Renewable infrastructure projects grow fast, and teams need accurate data to stay on track. Solar farms, wind energy parks, hydro projects, and other renewable installations operate with tight budgets, strict
Read More
Dashboard Power BI

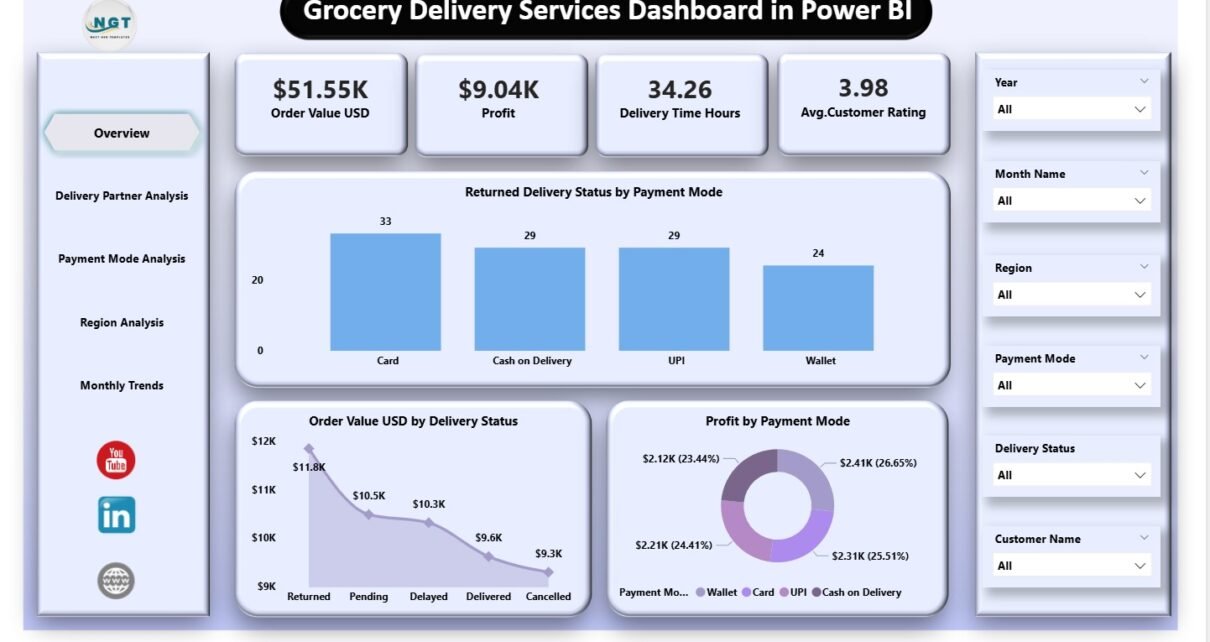
Grocery Delivery Services Dashboard in Power BI

December 4, 2025December 4, 2025 PKComments Off on Grocery Delivery Services Dashboard in Power BI
The grocery delivery industry continues to grow every year. Customers now expect fast delivery, fresh products, flexible payment options, and excellent service. Because competition increases daily, companies need strong insight
Read More

Posts pagination

Previous 1 … 56 57 58 … 85 Next
  • Learn Excel (Free Course)
    • 1. Shortcut Keys
    • 2. Fill & Flash Fill
    • 3. Find & Replace
    • 4. Sort & Filter
    • 5. Formulas & Functions
    • 6. Data Validation
    • 7. Conditional Formatting
    • 8. Basic Charts
    • 9. Advanced Charts
    • 10. Pivot Tables
    • 11. Excel Dashboards
    • 12. VBA Course
    • 13. Excel Formulas with AI
  • Templates
  • Tutorials
    • Charts and Visualization
    • VBA
    • Excel Tips and Tricks
    • Excel Dashboards
    • Power Pivot & DAX
  • Power BI
  • Template Store
    • Ready to Use Templates
  • Courses
  • Academy
    • Excel + AI Mastery: 100 Formulas
    • Excel Pivot Tables & Dashboards
  • About Us
  • Contact Us
Copyright © 2023 PK-AnExcelExpert.com - Privacy Policy