New: NextGenTemplates Academy - video courses on Excel formulas with AI and Pivot Tables & dashboards. Early-bird: 20% off with code EARLYBIRD20 - first 20 orders only. See the courses →
  • Learn Excel (Free Course)
    • 1. Shortcut Keys
    • 2. Fill & Flash Fill
    • 3. Find & Replace
    • 4. Sort & Filter
    • 5. Formulas & Functions
    • 6. Data Validation
    • 7. Conditional Formatting
    • 8. Basic Charts
    • 9. Advanced Charts
    • 10. Pivot Tables
    • 11. Excel Dashboards
    • 12. VBA Course
    • 13. Excel Formulas with AI
  • Templates
  • Tutorials
    • Charts and Visualization
    • VBA
    • Excel Tips and Tricks
    • Excel Dashboards
    • Power Pivot & DAX
  • Power BI
  • Template Store
    • Ready to Use Templates
  • Courses
  • Academy
    • Excel + AI Mastery: 100 Formulas
    • Excel Pivot Tables & Dashboards
  • About Us
  • Contact Us

PK: An Excel Expert

Transforming Data into Decisions

Tag: Power BI dashboard

Power BI

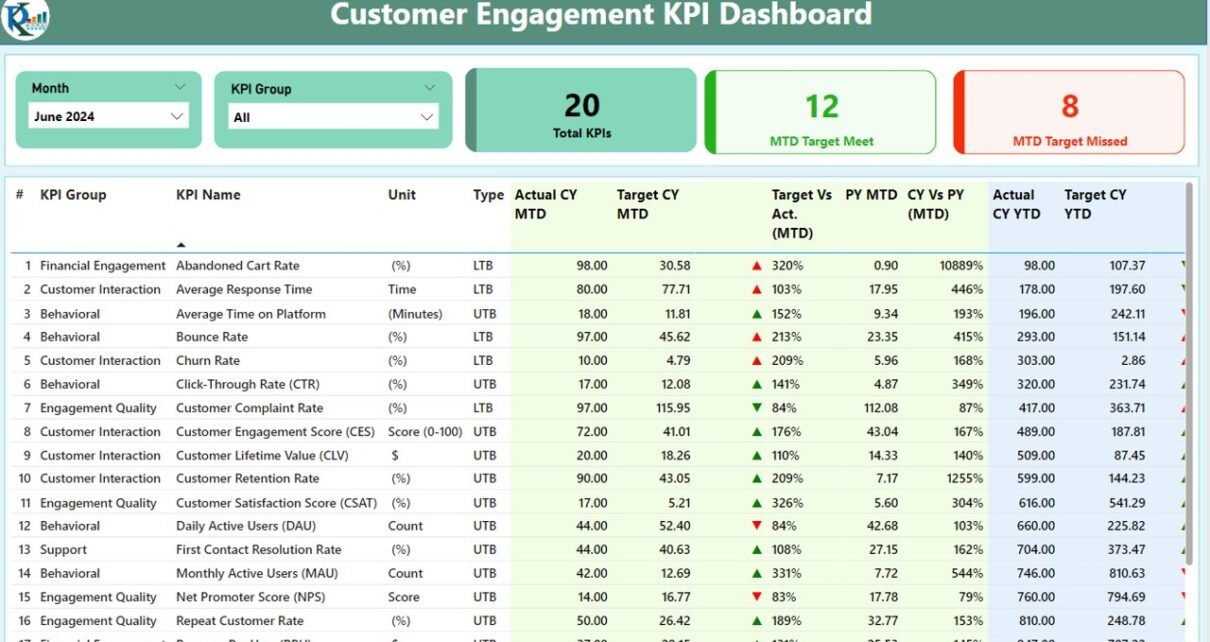
Customer Engagement KPI Dashboard in Power BI

January 24, 2025March 19, 2025 PKComments Off on Customer Engagement KPI Dashboard in Power BI
In today's data-driven world, understanding customer engagement is vital for making informed business decisions. With the help of powerful tools like Power BI, companies can build dashboards that allow them
Read More
Power BI

Healthcare Insurance KPI Dashboard Power BI

January 23, 2025March 20, 2025 PKComments Off on Healthcare Insurance KPI Dashboard Power BI
The healthcare industry is increasingly leveraging data to improve decision-making, streamline processes, and enhance the quality of care. Key Performance Indicators (KPIs) are crucial for assessing performance and ensuring that
Read More
Power BI

Transportation Safety KPI Dashboard in Power BI

January 22, 2025March 21, 2025 PKComments Off on Transportation Safety KPI Dashboard in Power BI
In the fast-evolving world of transportation, safety is always the number one priority. Ensuring that safety standards are met, reducing accidents, and improving operational efficiency are key goals for every
Read More
Power Pivot

Luxury Goods KPI Dashboard in Power BI

January 21, 2025March 21, 2025 PKComments Off on Luxury Goods KPI Dashboard in Power BI
The luxury goods industry is characterized by high-end products, affluent customers, and a competitive market. To remain competitive, brands in this space need to continuously monitor their performance, track key
Read More
Power BI

Charity Fundraising KPI Dashboard in Power BI

January 21, 2025March 21, 2025 PKComments Off on Charity Fundraising KPI Dashboard in Power BI
In today's fast-paced world of charity fundraising, data-driven decisions are essential for maximizing donations and reaching goals. A well-organized and insightful dashboard can significantly improve how fundraising campaigns are monitored
Read More
Dashboard

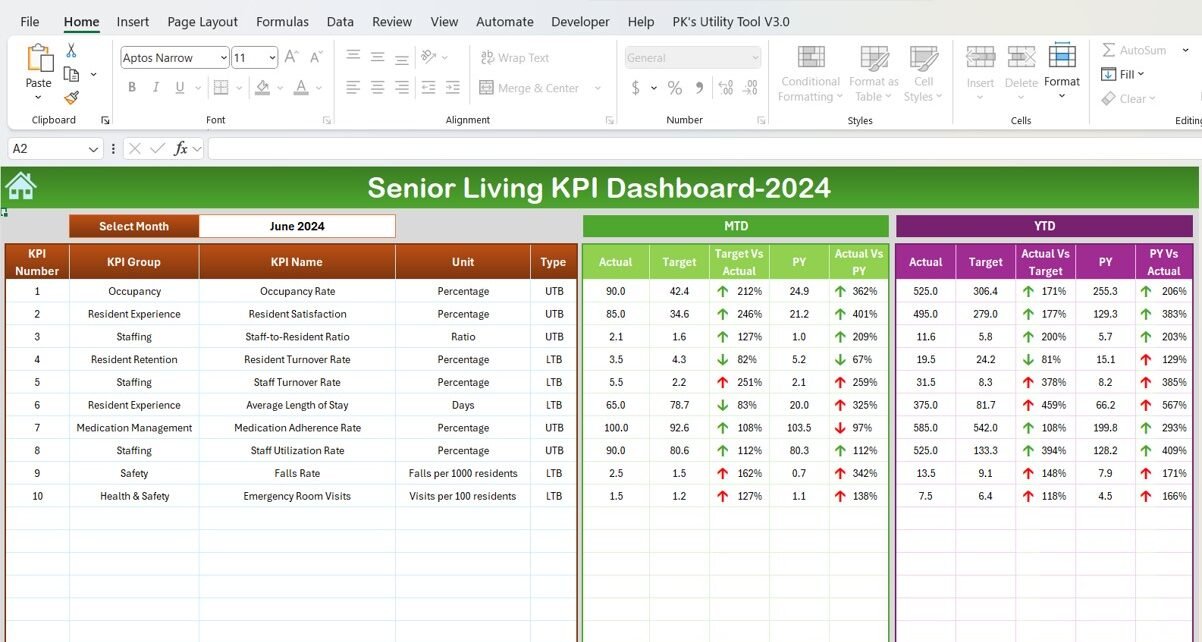
Senior Living KPI Dashboard in Excel

January 21, 2025March 23, 2025 PKComments Off on Senior Living KPI Dashboard in Excel
In the rapidly growing senior living industry, understanding and optimizing performance is key to providing high-quality care and ensuring business success. The Senior Living KPI Dashboard is a comprehensive tool
Read More
Dashboard

Rehabilitation Center KPI Dashboard in Excel

January 20, 2025March 23, 2025 PKComments Off on Rehabilitation Center KPI Dashboard in Excel
In today’s healthcare industry, measuring the success and performance of a rehabilitation center is critical for improving patient outcomes and optimizing operational efficiency. A Rehabilitation Center KPI (Key Performance Indicator)
Read More
Power BI

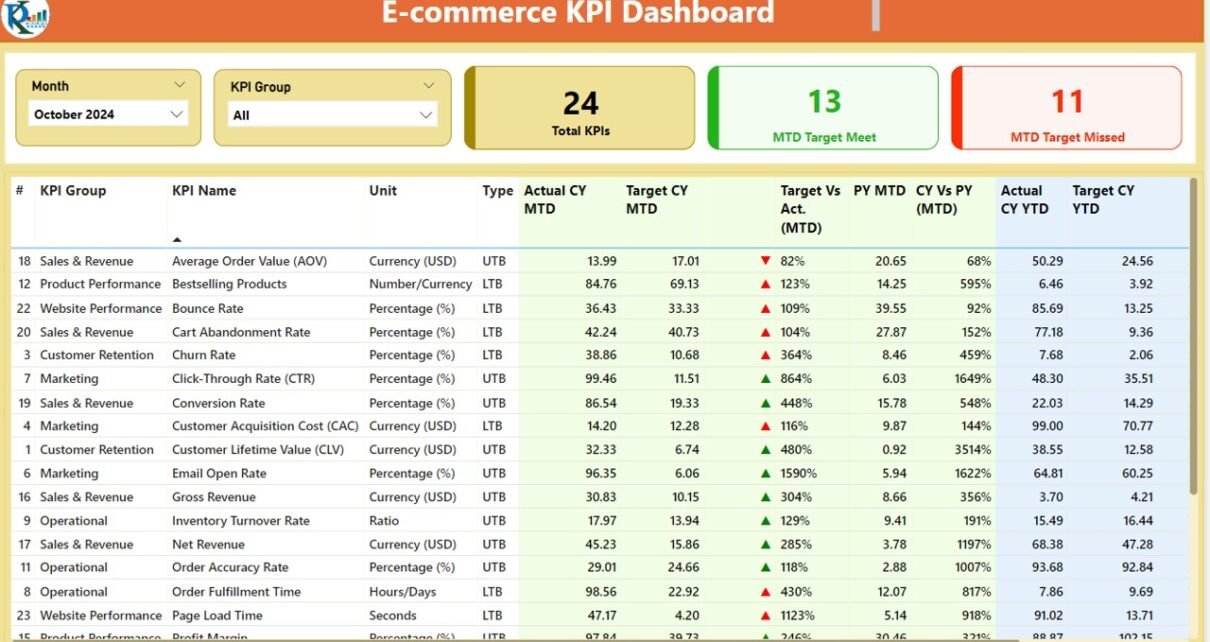
E-commerce KPI Dashboard in Power BI

January 18, 2025March 24, 2025 PKComments Off on E-commerce KPI Dashboard in Power BI
In the fast-paced world of e-commerce, businesses need to constantly track key performance indicators (KPIs) to measure success, optimize strategies, and stay competitive. With the E-commerce KPI Dashboard in Power
Read More
Power BI

R&D KPI Dashboard in Power BI

January 17, 2025March 26, 2025 PKComments Off on R&D KPI Dashboard in Power BI
In today’s data-driven world, research and development (R&D) teams need to track and measure key performance indicators (KPIs) effectively. An R&D KPI Dashboard in Power BI can be an essential
Read More
Power BI

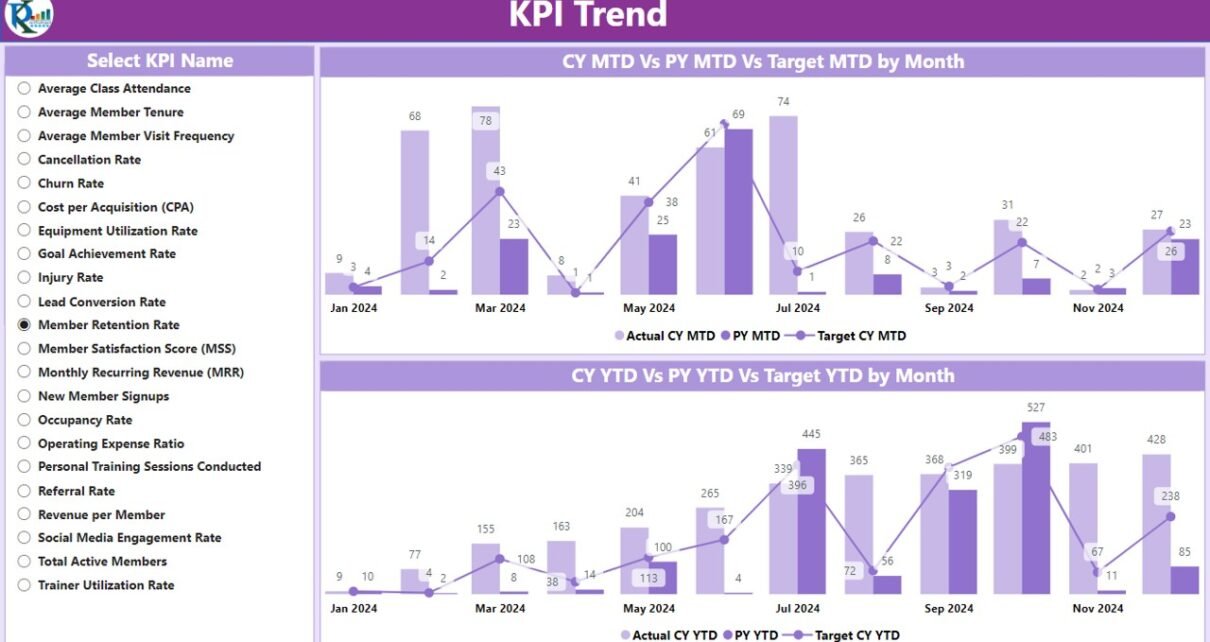
Fitness Industry KPI Dashboard in Power BI

January 17, 2025March 26, 2025 PKComments Off on Fitness Industry KPI Dashboard in Power BI
In the fast-paced and dynamic fitness industry, keeping track of key performance indicators (KPIs) is essential for measuring success and growth. Whether you're a fitness center owner, manager, or operator,
Read More

Posts pagination

Previous 1 … 82 83 84 85 Next
  • Learn Excel (Free Course)
    • 1. Shortcut Keys
    • 2. Fill & Flash Fill
    • 3. Find & Replace
    • 4. Sort & Filter
    • 5. Formulas & Functions
    • 6. Data Validation
    • 7. Conditional Formatting
    • 8. Basic Charts
    • 9. Advanced Charts
    • 10. Pivot Tables
    • 11. Excel Dashboards
    • 12. VBA Course
    • 13. Excel Formulas with AI
  • Templates
  • Tutorials
    • Charts and Visualization
    • VBA
    • Excel Tips and Tricks
    • Excel Dashboards
    • Power Pivot & DAX
  • Power BI
  • Template Store
    • Ready to Use Templates
  • Courses
  • Academy
    • Excel + AI Mastery: 100 Formulas
    • Excel Pivot Tables & Dashboards
  • About Us
  • Contact Us
Copyright © 2023 PK-AnExcelExpert.com - Privacy Policy