New: NextGenTemplates Academy - video courses on Excel formulas with AI and Pivot Tables & dashboards. Early-bird: 20% off with code EARLYBIRD20 - first 20 orders only. See the courses →
  • Learn Excel (Free Course)
    • 1. Shortcut Keys
    • 2. Fill & Flash Fill
    • 3. Find & Replace
    • 4. Sort & Filter
    • 5. Formulas & Functions
    • 6. Data Validation
    • 7. Conditional Formatting
    • 8. Basic Charts
    • 9. Advanced Charts
    • 10. Pivot Tables
    • 11. Excel Dashboards
    • 12. VBA Course
    • 13. Excel Formulas with AI
  • Templates
  • Tutorials
    • Charts and Visualization
    • VBA
    • Excel Tips and Tricks
    • Excel Dashboards
    • Power Pivot & DAX
  • Power BI
  • Template Store
    • Ready to Use Templates
  • Courses
  • Academy
    • Excel + AI Mastery: 100 Formulas
    • Excel Pivot Tables & Dashboards
  • About Us
  • Contact Us

PK: An Excel Expert

Transforming Data into Decisions

Tag: Power BI KPI Report

Dashboard Power BI

Trade Associations KPI Dashboard in Power BI

March 13, 2026March 13, 2026 PKComments Off on Trade Associations KPI Dashboard in Power BI
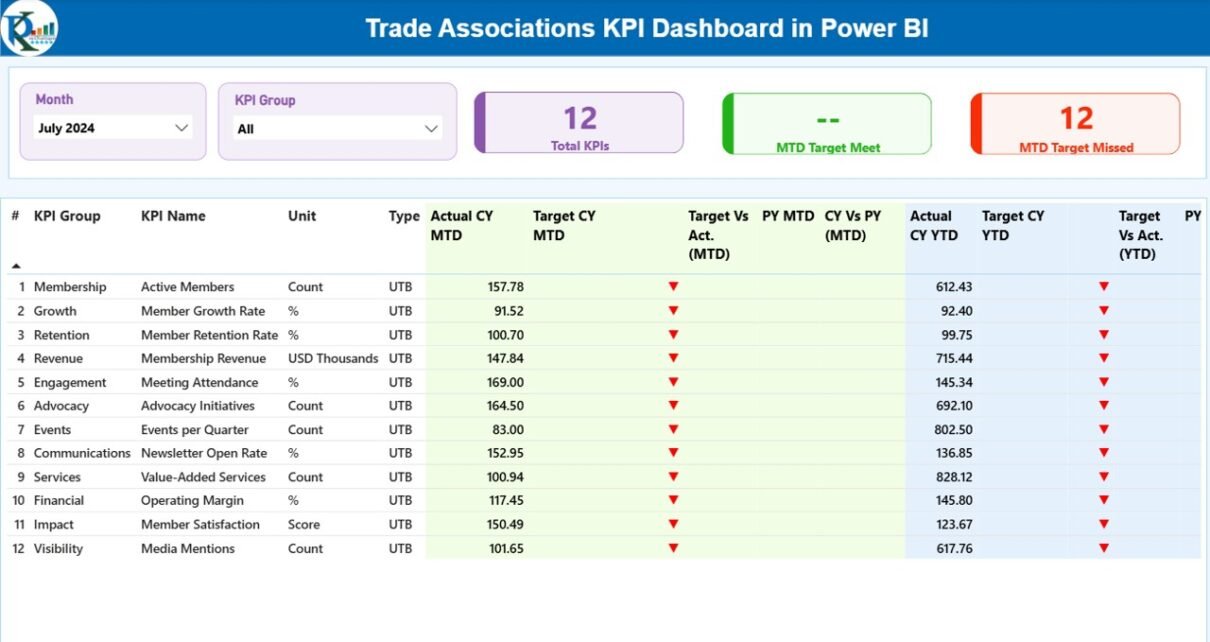
Trade associations play an important role in supporting businesses, industries, and professional communities. They represent member interests, organize events, influence policies, and promote industry growth. However, managing the performance of
Read More
Dashboard Power BI

Building Automation KPI Dashboard in Power BI

March 9, 2026March 9, 2026 PKComments Off on Building Automation KPI Dashboard in Power BI
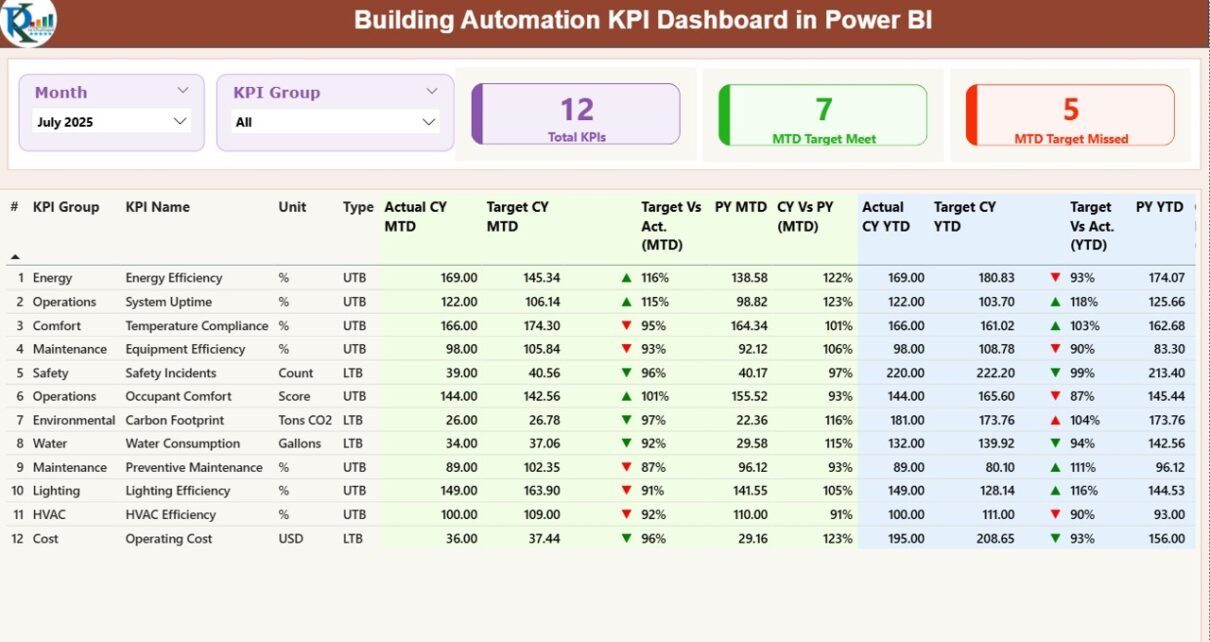
Modern buildings depend heavily on smart technologies. Systems such as HVAC, lighting control, energy monitoring, security systems, and facility automation generate large amounts of operational data every day. Therefore, organizations
Read More
Dashboard Power BI

Ceramic Manufacturing KPI Dashboard in Power BI

February 9, 2026February 9, 2026 PKComments Off on Ceramic Manufacturing KPI Dashboard in Power BI
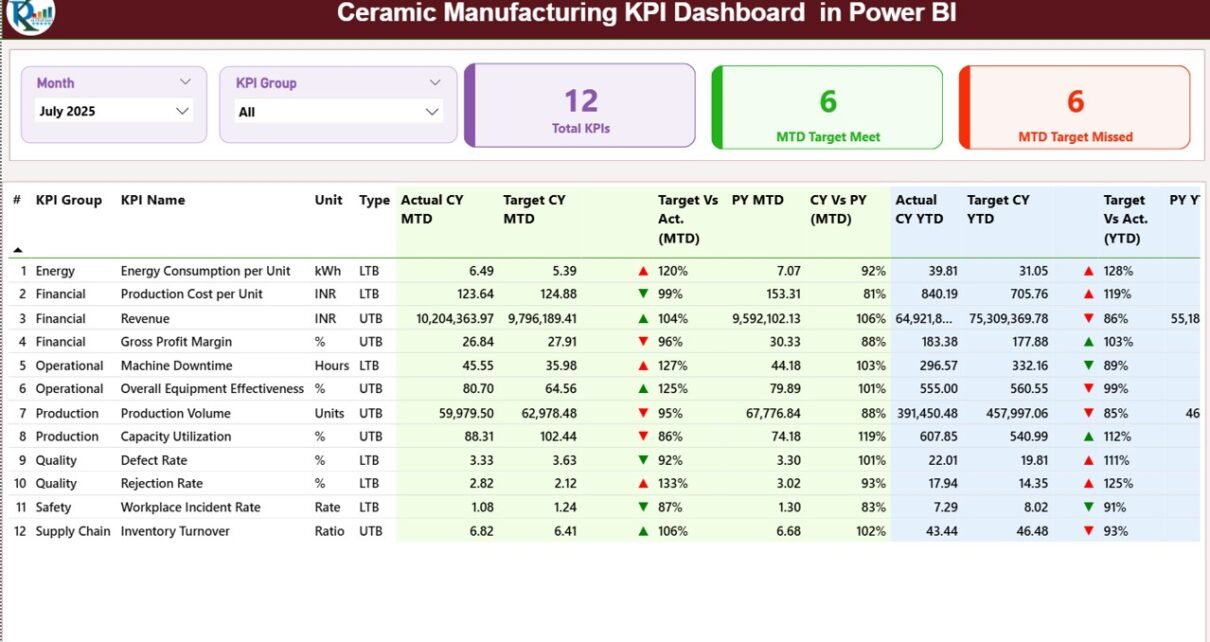
Ceramic manufacturing demands accuracy, speed, and cost control. Production targets must align with market demand. Kiln efficiency must remain stable. Quality standards must stay consistent.Ceramic Manufacturing KPI Dashboard in Power
Read More
Dashboard Power BI

Spas and Wellness Centres KPI Dashboard in Power BI

January 23, 2026January 23, 2026 PKComments Off on Spas and Wellness Centres KPI Dashboard in Power BI
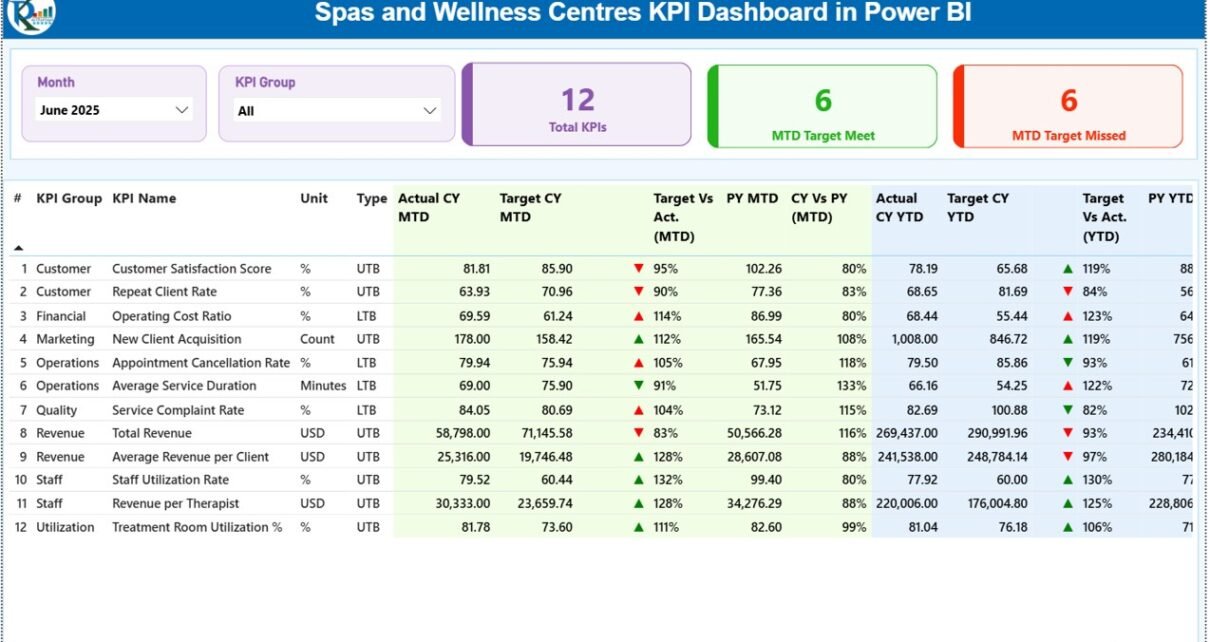
Spas and wellness centres focus on delivering relaxation, care, and premium experiences. However, behind the scenes, managers must track performance, control costs, improve customer satisfaction, and grow revenue. When teams
Read More
  • Learn Excel (Free Course)
    • 1. Shortcut Keys
    • 2. Fill & Flash Fill
    • 3. Find & Replace
    • 4. Sort & Filter
    • 5. Formulas & Functions
    • 6. Data Validation
    • 7. Conditional Formatting
    • 8. Basic Charts
    • 9. Advanced Charts
    • 10. Pivot Tables
    • 11. Excel Dashboards
    • 12. VBA Course
    • 13. Excel Formulas with AI
  • Templates
  • Tutorials
    • Charts and Visualization
    • VBA
    • Excel Tips and Tricks
    • Excel Dashboards
    • Power Pivot & DAX
  • Power BI
  • Template Store
    • Ready to Use Templates
  • Courses
  • Academy
    • Excel + AI Mastery: 100 Formulas
    • Excel Pivot Tables & Dashboards
  • About Us
  • Contact Us
Copyright © 2023 PK-AnExcelExpert.com - Privacy Policy