New: NextGenTemplates Academy - video courses on Excel formulas with AI and Pivot Tables & dashboards. Early-bird: 20% off with code EARLYBIRD20 - first 20 orders only. See the courses →
  • Learn Excel (Free Course)
    • 1. Shortcut Keys
    • 2. Fill & Flash Fill
    • 3. Find & Replace
    • 4. Sort & Filter
    • 5. Formulas & Functions
    • 6. Data Validation
    • 7. Conditional Formatting
    • 8. Basic Charts
    • 9. Advanced Charts
    • 10. Pivot Tables
    • 11. Excel Dashboards
    • 12. VBA Course
    • 13. Excel Formulas with AI
  • Templates
  • Tutorials
    • Charts and Visualization
    • VBA
    • Excel Tips and Tricks
    • Excel Dashboards
    • Power Pivot & DAX
  • Power BI
  • Template Store
    • Ready to Use Templates
  • Courses
  • Academy
    • Excel + AI Mastery: 100 Formulas
    • Excel Pivot Tables & Dashboards
  • About Us
  • Contact Us

PK: An Excel Expert

Transforming Data into Decisions

Tag: Power BI reports

Dashboard Power BI

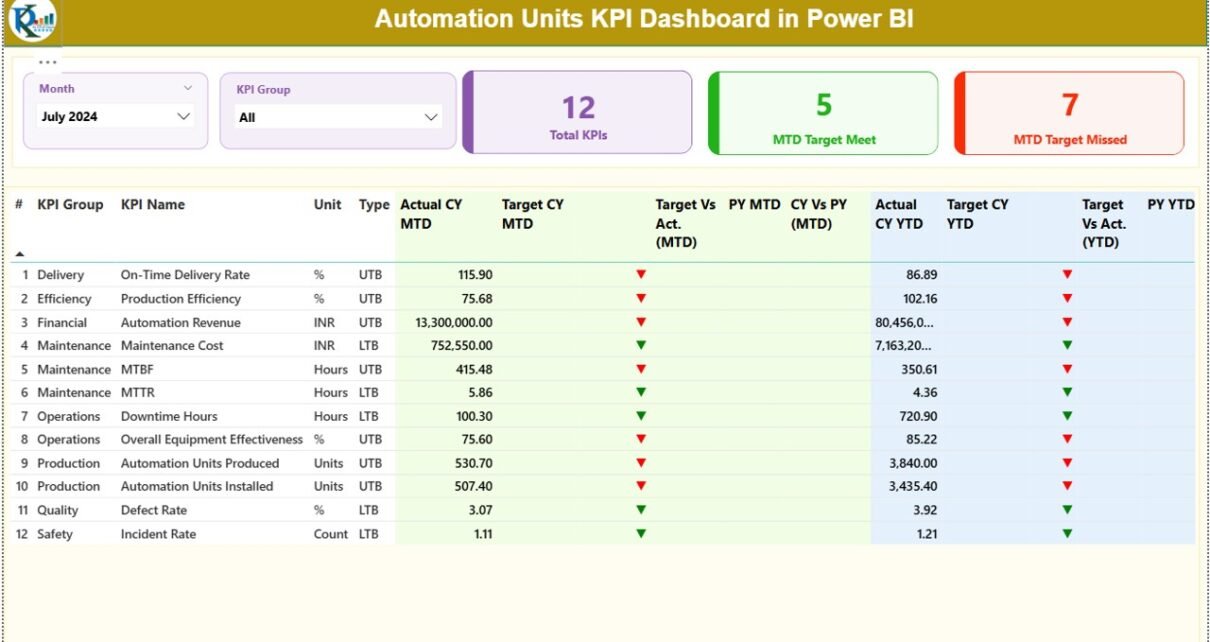
Automation Units KPI Dashboard in Power BI

January 19, 2026January 19, 2026 PKComments Off on Automation Units KPI Dashboard in Power BI
In today’s fast-moving industrial and manufacturing environment, automation units play a critical role in productivity, quality, and cost control. However, automation without measurement creates blind spots. Therefore, organizations increasingly rely
Read More
Dashboard Power BI

Veterinary Services Dashboard in Power BI

January 18, 2026January 18, 2026 PKComments Off on Veterinary Services Dashboard in Power BI
Running a veterinary clinic involves far more than treating pets. You manage appointments, medications, service costs, customer satisfaction, and monthly performance at the same time. However, when this data stays
Read More
Dashboard Power BI

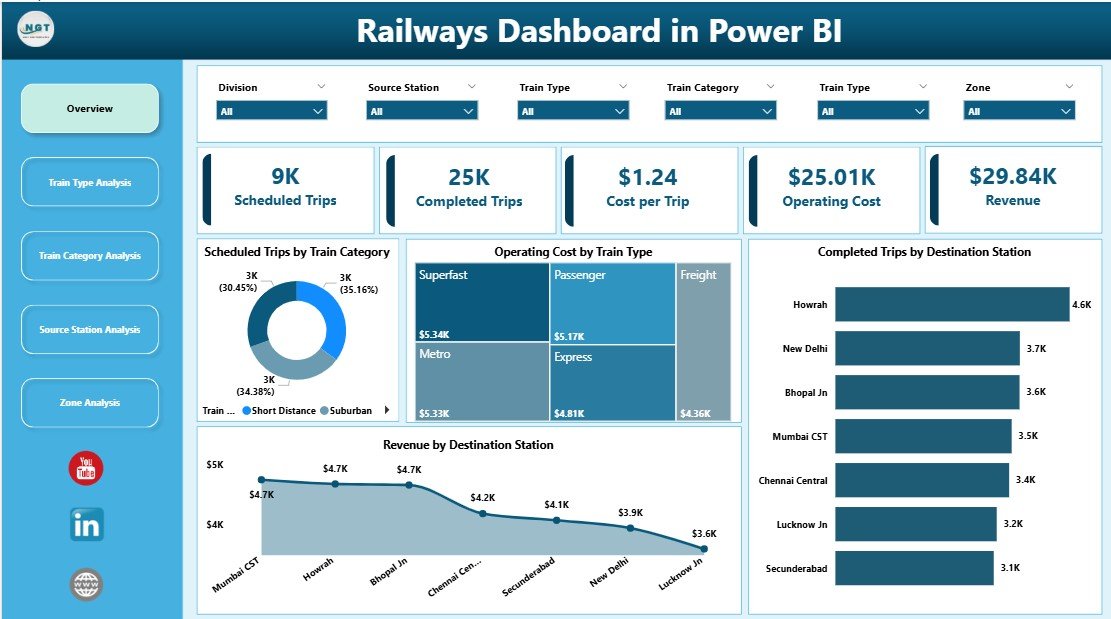
Railways Dashboard in Power BI

January 15, 2026January 15, 2026 PKComments Off on Railways Dashboard in Power BI
Railway networks manage thousands of trips, stations, zones, and train categories every day. Because operations run at such scale, decision-makers need clear visibility into performance, cost, and revenue. However, traditional
Read More
Dashboard Power BI

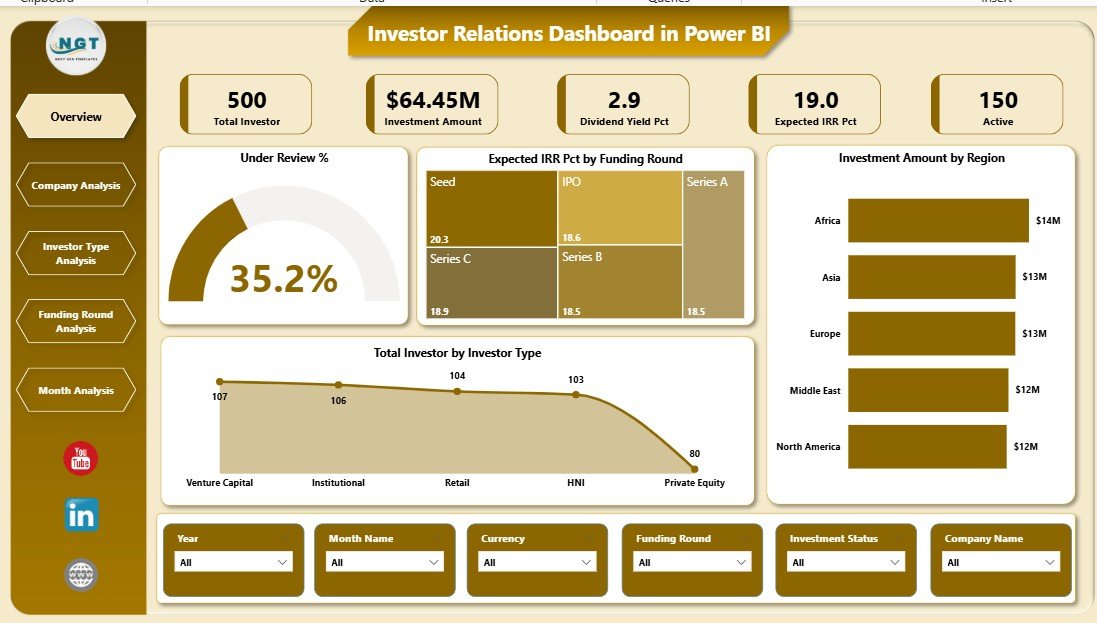
Investor Relations Dashboard in Power BI

January 15, 2026January 15, 2026 PKComments Off on Investor Relations Dashboard in Power BI
Investor relations play a critical role in building trust, transparency, and long-term value between organizations and their investors. However, managing investor data using scattered spreadsheets, static reports, and manual presentations
Read More
Dashboard Power BI

Refinery Dashboard in Power BI

January 3, 2026January 3, 2026 PKComments Off on Refinery Dashboard in Power BI
Managing a refinery involves thousands of daily decisions. Leaders must control costs, reduce downtime, optimize energy usage, and increase output at the same time. However, when teams rely on scattered
Read More
Dashboard Power BI

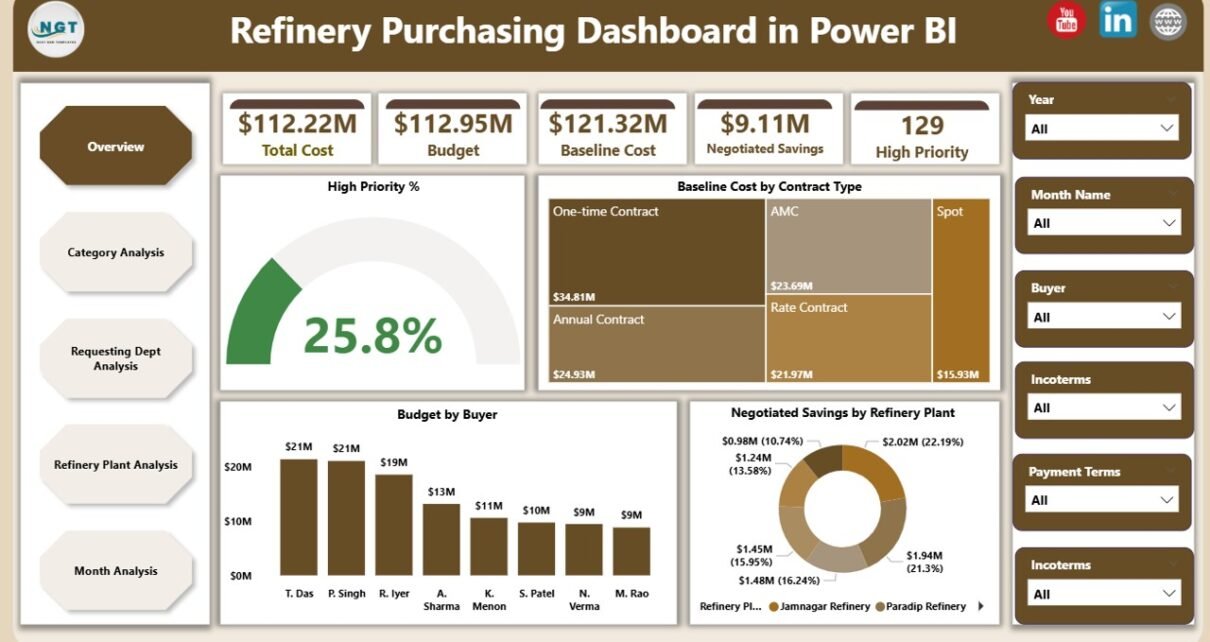
Refinery Purchasing Dashboard in Power BI

December 26, 2025December 26, 2025 PKComments Off on Refinery Purchasing Dashboard in Power BI
Managing refinery purchasing operations without clear visibility often leads to cost overruns, delayed approvals, and missed savings opportunities. However, when organizations implement a Refinery Purchasing Dashboard in Power BI, they
Read More
Dashboard Power BI

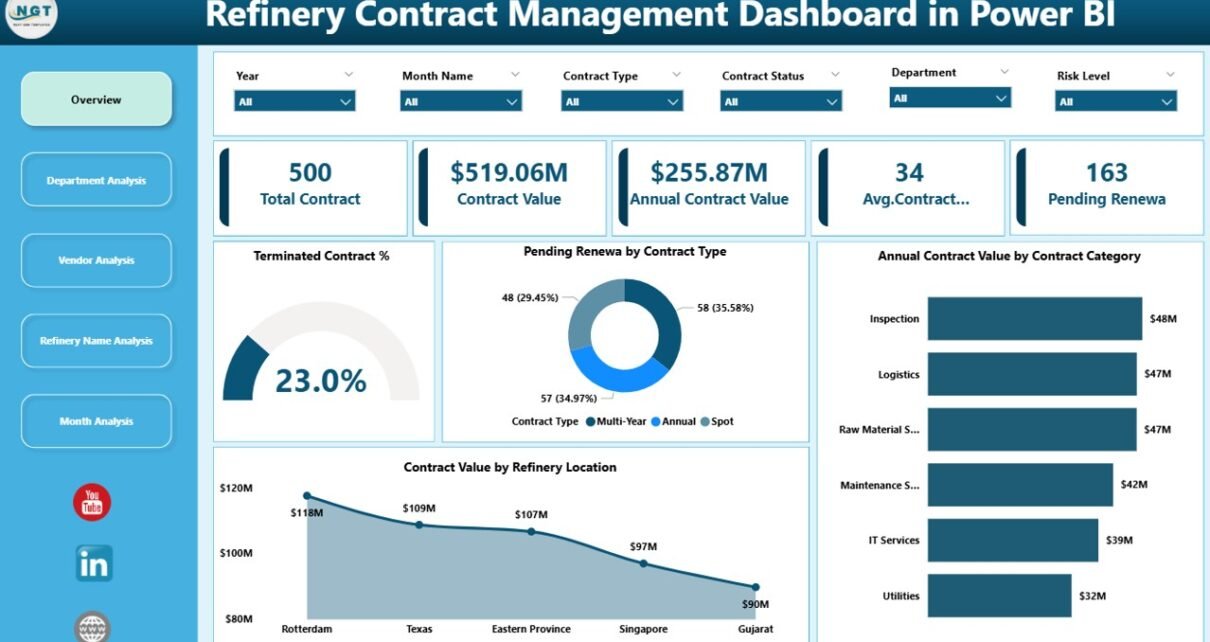
Refinery Contract Management Dashboard in Power BI

December 26, 2025December 26, 2025 PKComments Off on Refinery Contract Management Dashboard in Power BI
Managing refinery contracts is never simple. In fact, refinery operations involve high-value agreements, long-term vendor relationships, strict compliance requirements, and continuous monitoring of renewals, values, and risks. Therefore, when organizations
Read More
Dashboard Power BI

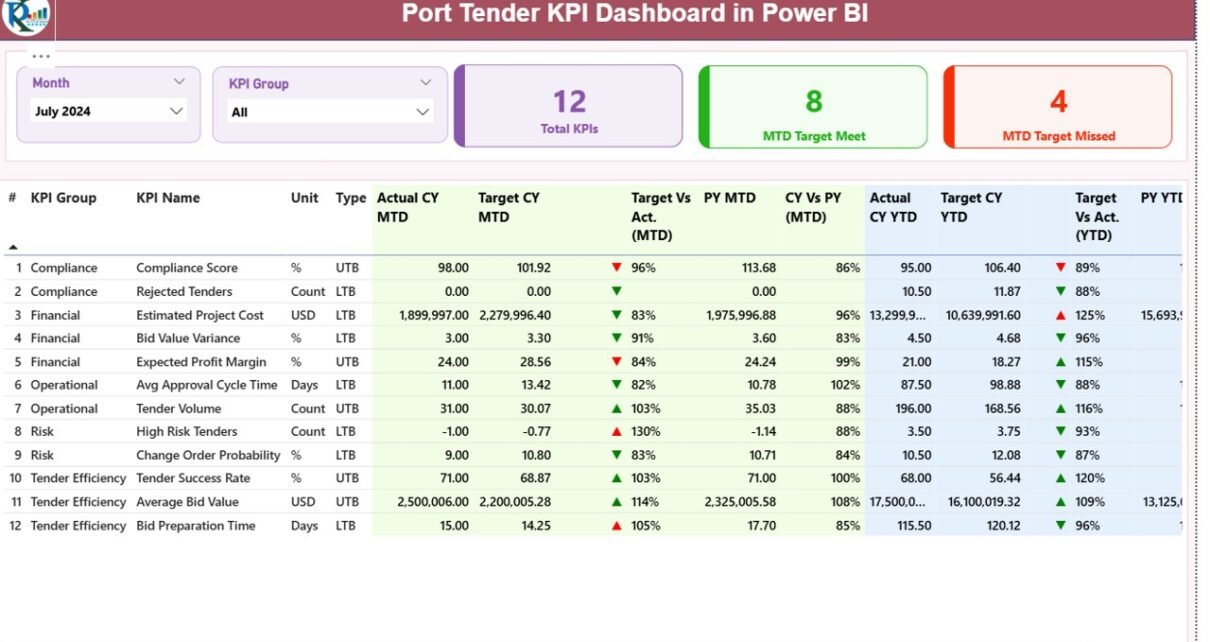
Port Tender KPI Dashboard in Power BI

December 25, 2025October 10, 2026 PKComments Off on Port Tender KPI Dashboard in Power BI
Managing port tenders involves complex processes, strict compliance, multiple stakeholders, and continuous performance monitoring. However, when organizations rely only on spreadsheets or manual tracking, they often face delays, errors, and
Read More
Dashboard Power BI

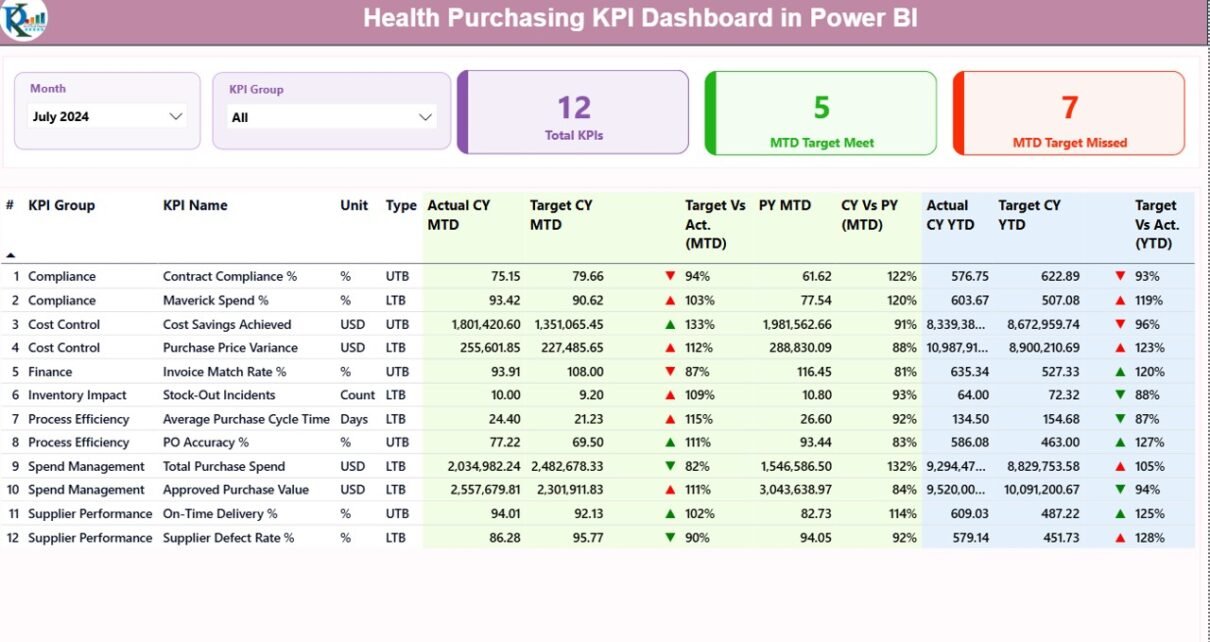
Health Purchasing KPI Dashboard in Power BI

December 25, 2025December 25, 2025 PKComments Off on Health Purchasing KPI Dashboard in Power BI
Healthcare organizations handle thousands of purchasing transactions every month. Therefore, without a structured monitoring system, purchasing teams often struggle with cost overruns, supplier inefficiencies, and missed performance targets. That is
Read More
Dashboard Power BI

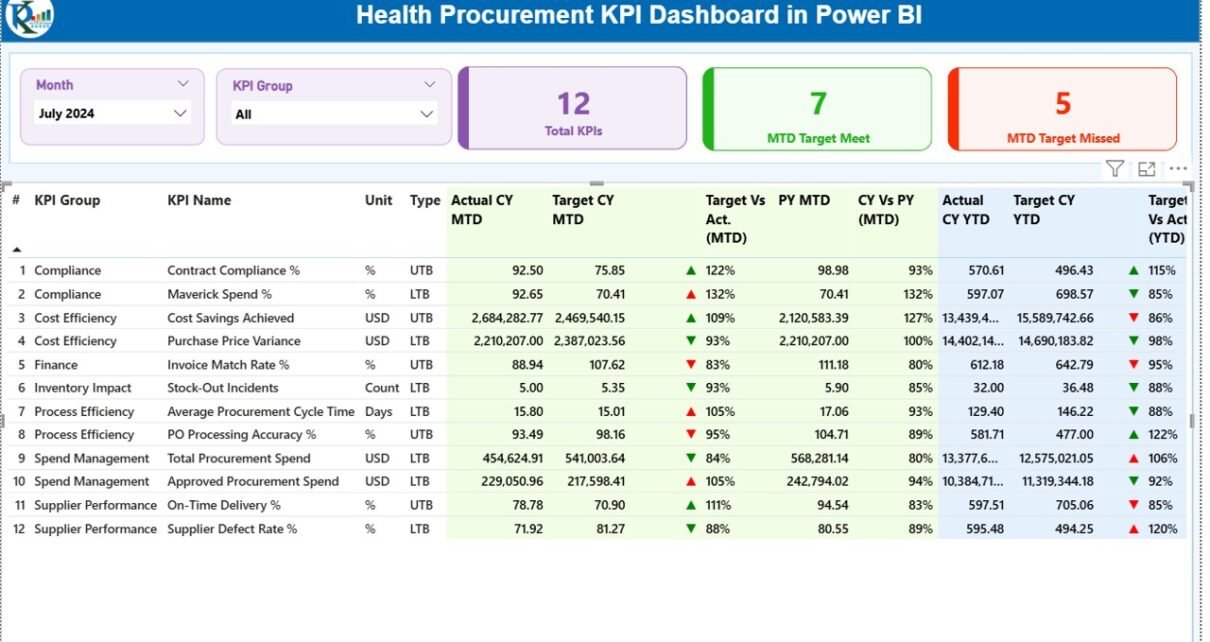
Health Procurement KPI Dashboard in Power BI

December 25, 2025December 25, 2025 PKComments Off on Health Procurement KPI Dashboard in Power BI
Managing healthcare procurement without accurate performance tracking creates delays, overspending, and compliance risks. Therefore, healthcare organizations now rely heavily on data-driven dashboards to monitor procurement efficiency and control costs. One
Read More

Posts pagination

Previous 1 … 7 8 9 … 13 Next
  • Learn Excel (Free Course)
    • 1. Shortcut Keys
    • 2. Fill & Flash Fill
    • 3. Find & Replace
    • 4. Sort & Filter
    • 5. Formulas & Functions
    • 6. Data Validation
    • 7. Conditional Formatting
    • 8. Basic Charts
    • 9. Advanced Charts
    • 10. Pivot Tables
    • 11. Excel Dashboards
    • 12. VBA Course
    • 13. Excel Formulas with AI
  • Templates
  • Tutorials
    • Charts and Visualization
    • VBA
    • Excel Tips and Tricks
    • Excel Dashboards
    • Power Pivot & DAX
  • Power BI
  • Template Store
    • Ready to Use Templates
  • Courses
  • Academy
    • Excel + AI Mastery: 100 Formulas
    • Excel Pivot Tables & Dashboards
  • About Us
  • Contact Us
Copyright © 2023 PK-AnExcelExpert.com - Privacy Policy