New: NextGenTemplates Academy - video courses on Excel formulas with AI and Pivot Tables & dashboards. Early-bird: 20% off with code EARLYBIRD20 - first 20 orders only. See the courses →
  • Learn Excel (Free Course)
    • 1. Shortcut Keys
    • 2. Fill & Flash Fill
    • 3. Find & Replace
    • 4. Sort & Filter
    • 5. Formulas & Functions
    • 6. Data Validation
    • 7. Conditional Formatting
    • 8. Basic Charts
    • 9. Advanced Charts
    • 10. Pivot Tables
    • 11. Excel Dashboards
    • 12. VBA Course
    • 13. Excel Formulas with AI
  • Templates
  • Tutorials
    • Charts and Visualization
    • VBA
    • Excel Tips and Tricks
    • Excel Dashboards
    • Power Pivot & DAX
  • Power BI
  • Template Store
    • Ready to Use Templates
  • Courses
  • Academy
    • Excel + AI Mastery: 100 Formulas
    • Excel Pivot Tables & Dashboards
  • About Us
  • Contact Us

PK: An Excel Expert

Transforming Data into Decisions

Tag: Power BI Templates

Dashboard Power BI

Credit Rating Agencies KPI Dashboard in Power BI

November 16, 2025November 16, 2025 PKComments Off on Credit Rating Agencies KPI Dashboard in Power BI
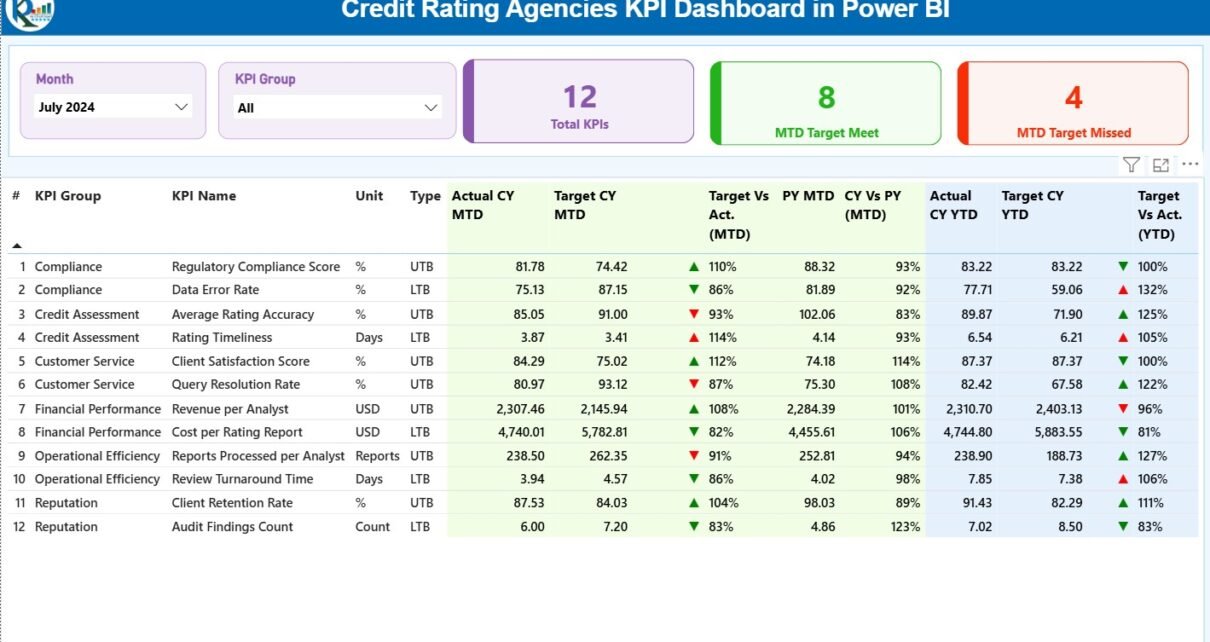
Credit rating agencies play an important role in global financial stability. They evaluate the creditworthiness of governments, corporations, financial institutions, and investment products. Because their ratings influence investments, lending decisions,
Read More
Dashboard Power BI

Electronics & Semiconductors Dashboard in Power BI

November 16, 2025November 16, 2025 PKComments Off on Electronics & Semiconductors Dashboard in Power BI
The electronics and semiconductor industry grows fast. Every day, companies handle thousands of data points related to costs, production, energy usage, and revenue. Because the industry moves at high speed,
Read More
Dashboard Power BI

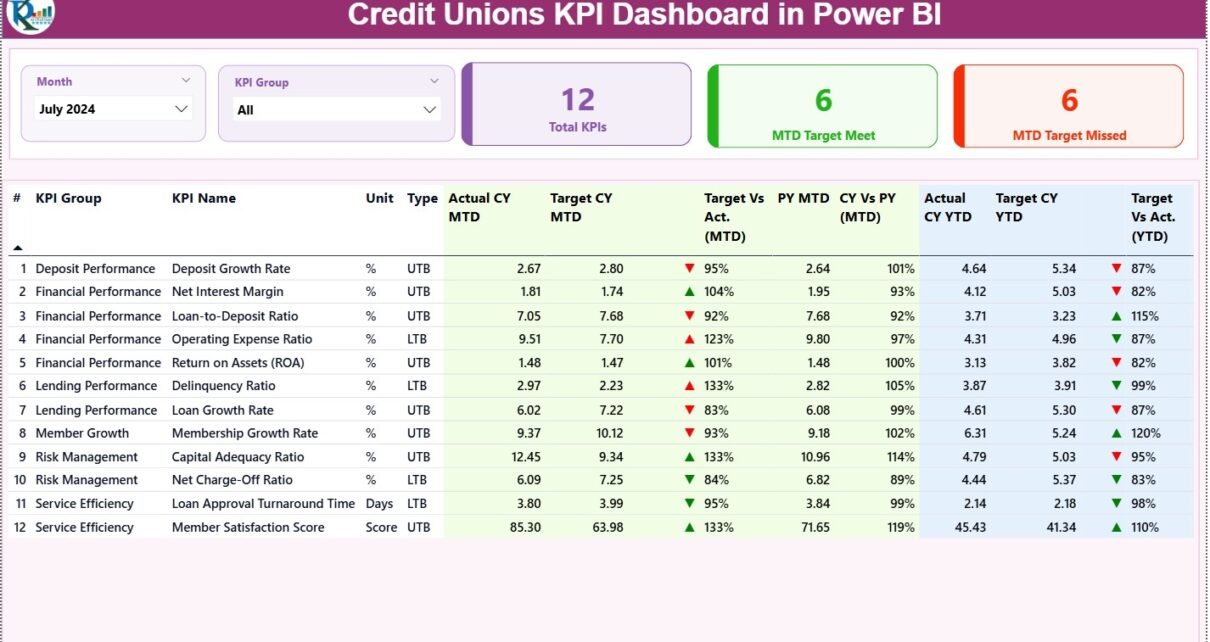
Credit Unions KPI Dashboard in Power BI

November 16, 2025November 16, 2025 PKComments Off on Credit Unions KPI Dashboard in Power BI
Credit unions run on trust, member satisfaction, financial transparency, and strong operational efficiency. However, you cannot improve performance unless you track the right numbers at the right time. This is
Read More
Templates

Research & Development (R&D) KPI Dashboard in Power BI

November 15, 2025November 15, 2025 PKComments Off on Research & Development (R&D) KPI Dashboard in Power BI
Improving Research & Development (R&D) performance takes clarity, strong monitoring, and timely decisions. R&D teams work on multiple projects, experiments, prototypes, and innovations at the same time. As a result,
Read More
Dashboard Power BI

Accounting Firms KPI Dashboard in Power BI

November 15, 2025November 15, 2025 PKComments Off on Accounting Firms KPI Dashboard in Power BI
Accounting firms handle many daily tasks. They track client projects, billing hours, revenue, compliance, audits, cash flow, productivity, and many other financial KPIs. When this information sits in multiple Excel
Read More
Dashboard Power BI

Power Generation Dashboard in Power BI

November 15, 2025November 15, 2025 PKComments Off on Power Generation Dashboard in Power BI
The energy sector changes fast, and power generation companies must track performance, cost, downtime, and revenue in real time. When this data stays scattered across spreadsheets and manual reports, managers
Read More
Dashboard Power BI

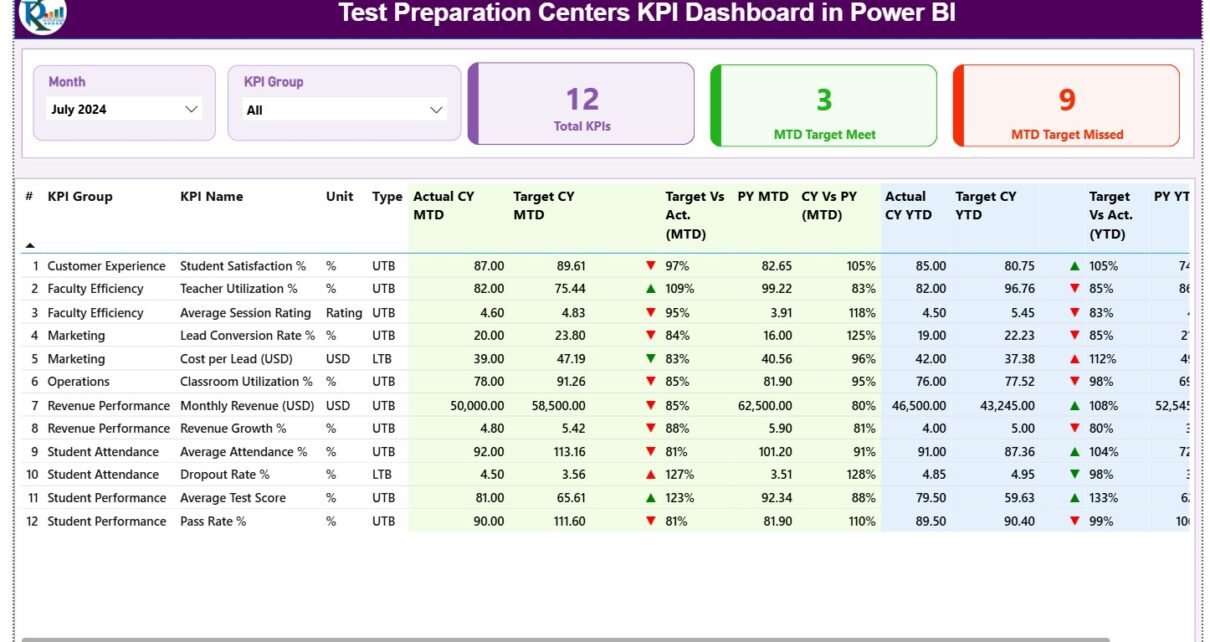
Test Preparation Centres KPI Dashboard in Power BI

November 15, 2025November 15, 2025 PKComments Off on Test Preparation Centres KPI Dashboard in Power BI
Running a test preparation centre feels exciting because you help students achieve their academic dreams. However, it also brings many challenges. You track student performance, enrollments, attendance, revenue, satisfaction, instructor
Read More
Dashboard Power BI

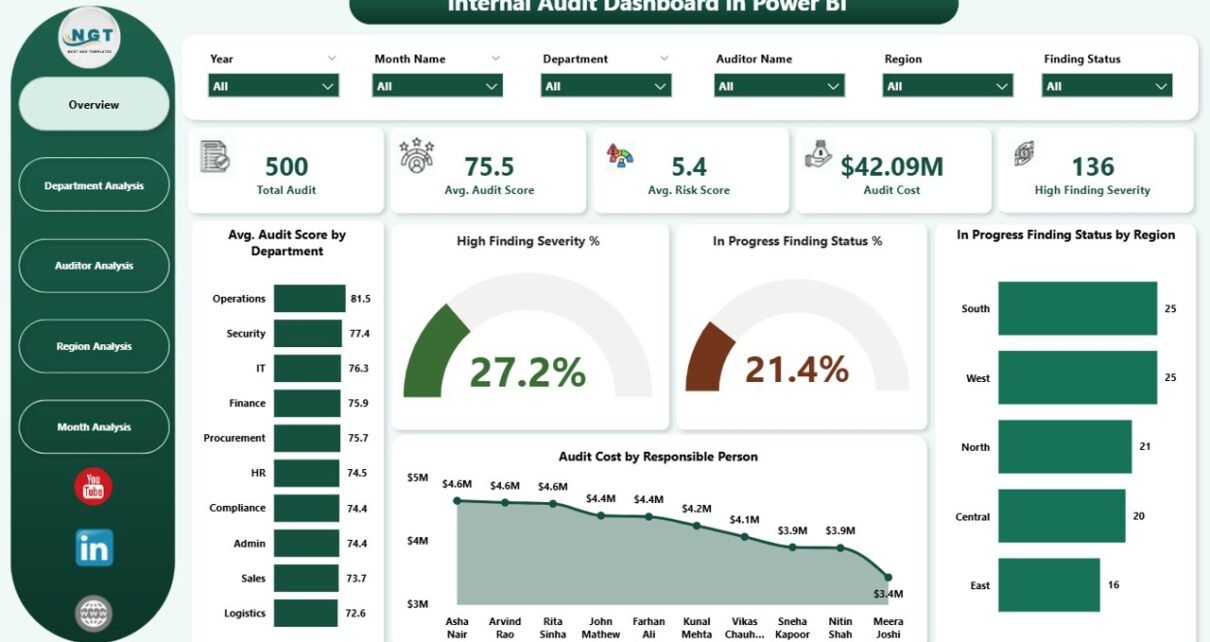
Internal Audit Dashboard in Power BI

November 14, 2025November 14, 2025 PKComments Off on Internal Audit Dashboard in Power BI
Running internal audits feels demanding because every department generates massive amounts of data. You track risks, findings, severity levels, audit scores, progress status, and cost. Because this information stays scattered
Read More
Dashboard Power BI

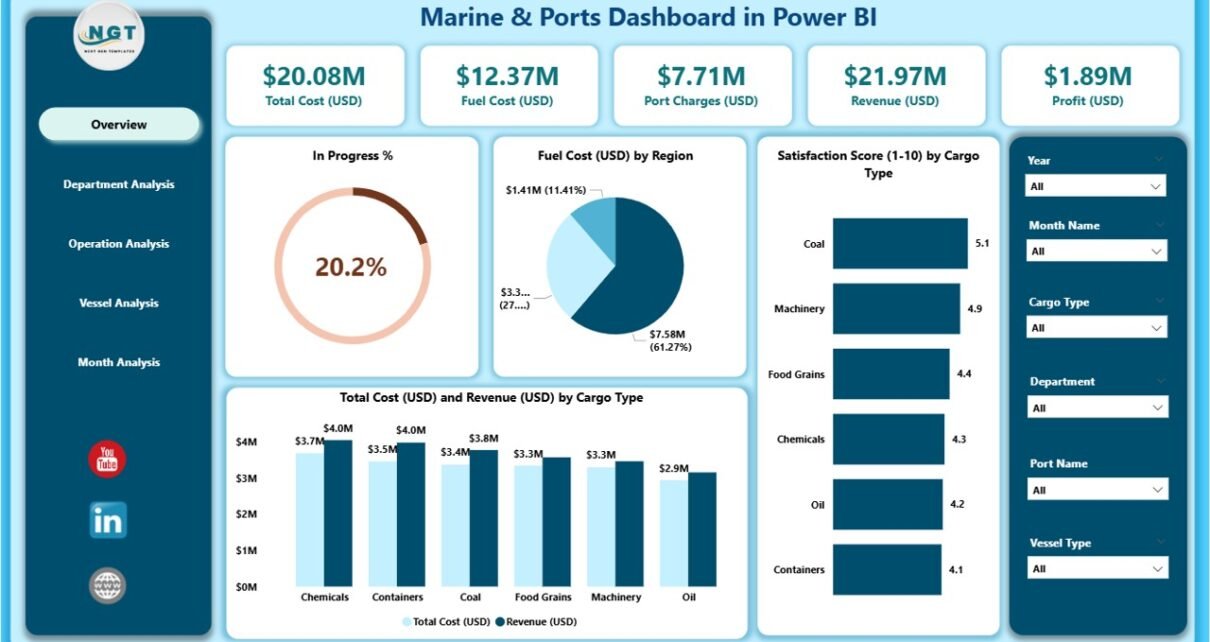
Marine & Ports Dashboard in Power BI

November 14, 2025November 14, 2025 PKComments Off on Marine & Ports Dashboard in Power BI
Marine operations sit at the center of global trade. Ports handle massive cargo volumes, manage vessel traffic, monitor fuel usage, and maintain strict operational safety standards. Because the marine and
Read More
Templates

Human Resources (HR) KPI Dashboard in Power BI

November 14, 2025November 14, 2025 PKComments Off on Human Resources (HR) KPI Dashboard in Power BI
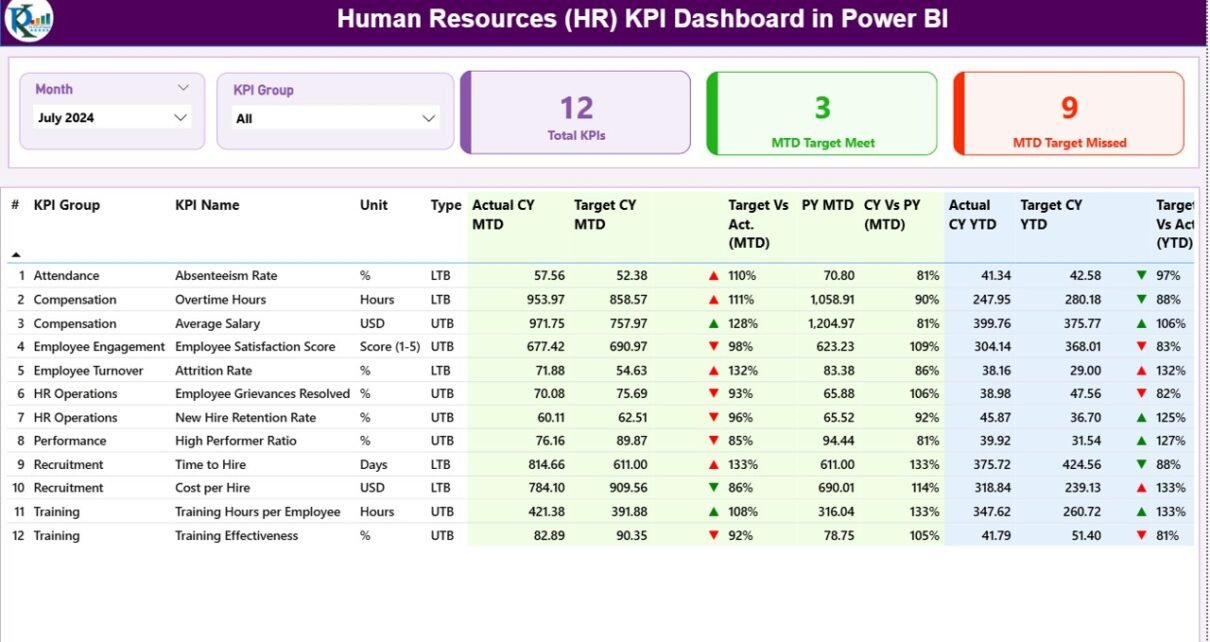
Human Resources teams manage many activities every single day. They track hiring, employee engagement, attendance, training, turnover, diversity, payroll, and performance. Because so many things happen at the same time,
Read More

Posts pagination

Previous 1 … 24 25 26 … 32 Next
  • Learn Excel (Free Course)
    • 1. Shortcut Keys
    • 2. Fill & Flash Fill
    • 3. Find & Replace
    • 4. Sort & Filter
    • 5. Formulas & Functions
    • 6. Data Validation
    • 7. Conditional Formatting
    • 8. Basic Charts
    • 9. Advanced Charts
    • 10. Pivot Tables
    • 11. Excel Dashboards
    • 12. VBA Course
    • 13. Excel Formulas with AI
  • Templates
  • Tutorials
    • Charts and Visualization
    • VBA
    • Excel Tips and Tricks
    • Excel Dashboards
    • Power Pivot & DAX
  • Power BI
  • Template Store
    • Ready to Use Templates
  • Courses
  • Academy
    • Excel + AI Mastery: 100 Formulas
    • Excel Pivot Tables & Dashboards
  • About Us
  • Contact Us
Copyright © 2023 PK-AnExcelExpert.com - Privacy Policy