New: NextGenTemplates Academy - video courses on Excel formulas with AI and Pivot Tables & dashboards. Early-bird: 20% off with code EARLYBIRD20 - first 20 orders only. See the courses →
  • Learn Excel (Free Course)
    • 1. Shortcut Keys
    • 2. Fill & Flash Fill
    • 3. Find & Replace
    • 4. Sort & Filter
    • 5. Formulas & Functions
    • 6. Data Validation
    • 7. Conditional Formatting
    • 8. Basic Charts
    • 9. Advanced Charts
    • 10. Pivot Tables
    • 11. Excel Dashboards
    • 12. VBA Course
    • 13. Excel Formulas with AI
  • Templates
  • Tutorials
    • Charts and Visualization
    • VBA
    • Excel Tips and Tricks
    • Excel Dashboards
    • Power Pivot & DAX
  • Power BI
  • Template Store
    • Ready to Use Templates
  • Courses
  • Academy
    • Excel + AI Mastery: 100 Formulas
    • Excel Pivot Tables & Dashboards
  • About Us
  • Contact Us

PK: An Excel Expert

Transforming Data into Decisions

Tag: Production Monitoring Excel

Dashboard

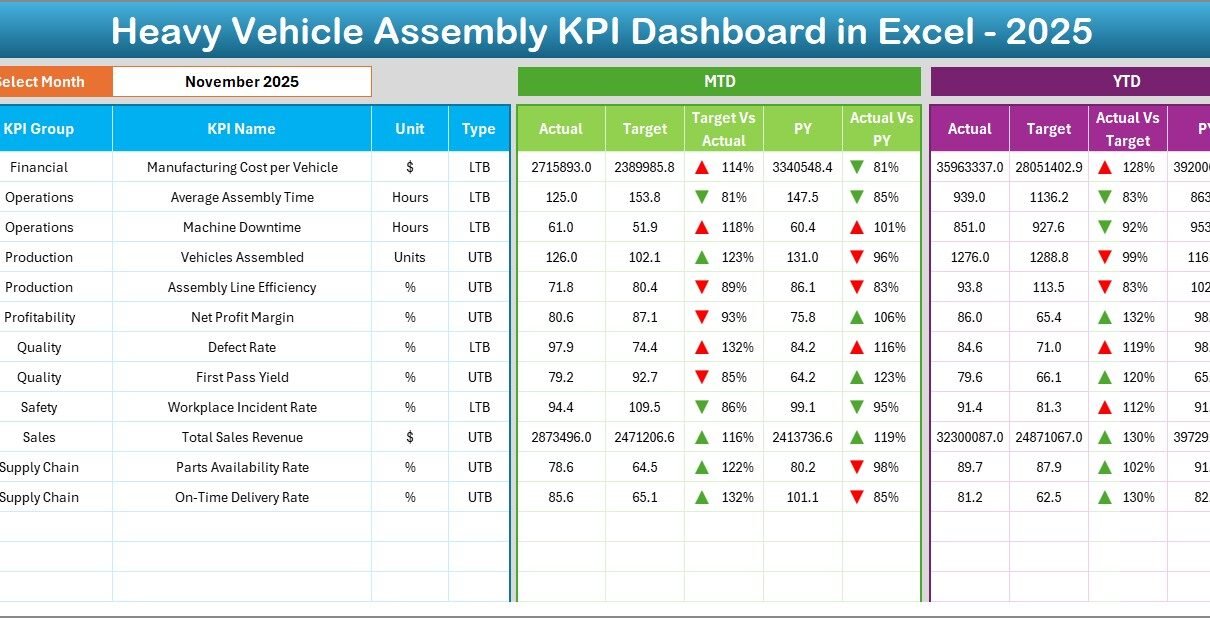
Heavy Vehicle Assembly KPI Dashboard in Excel

February 28, 2026February 28, 2026 PKComments Off on Heavy Vehicle Assembly KPI Dashboard in Excel
In today’s competitive manufacturing environment, heavy vehicle assembly companies must monitor production efficiency, quality performance, operational costs, and workforce productivity continuously. However, many organizations still rely on disconnected spreadsheets and
Read More
Dashboard

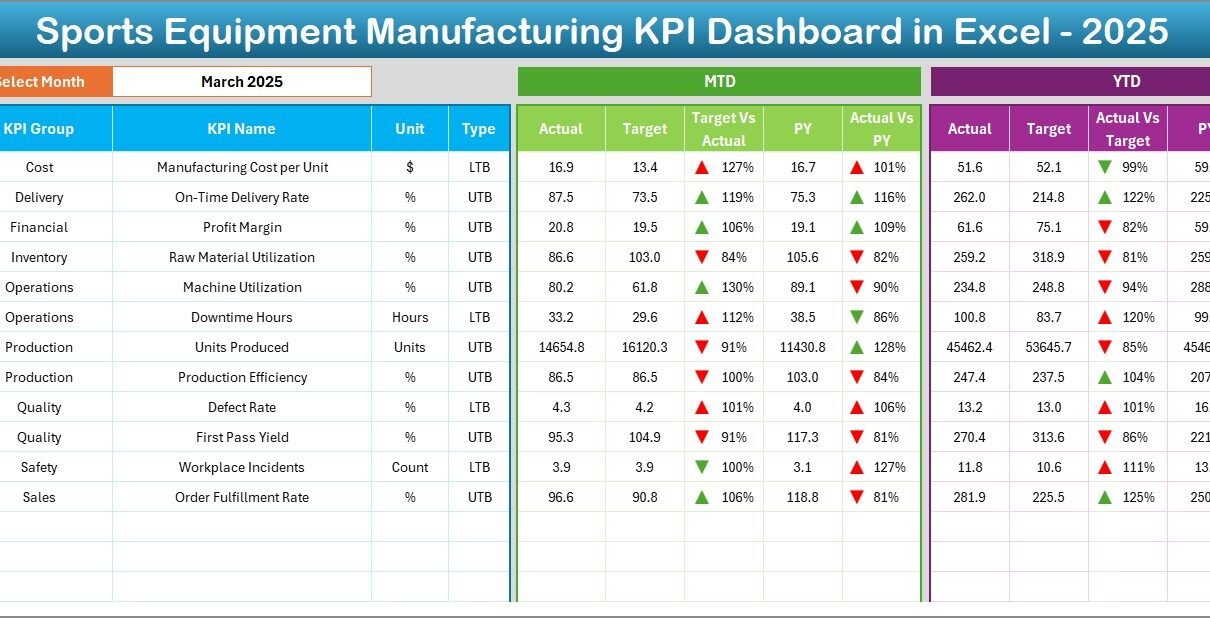
Sports Equipment Manufacturing KPI Dashboard in Excel

February 25, 2026February 25, 2026 PKComments Off on Sports Equipment Manufacturing KPI Dashboard in Excel
Manufacturing sports equipment requires precision, efficiency, quality control, and continuous performance monitoring. Companies must manage production schedules, raw material consumption, workforce productivity, machine utilization, defect rates, and delivery timelines simultaneously.
Read More
Dashboard

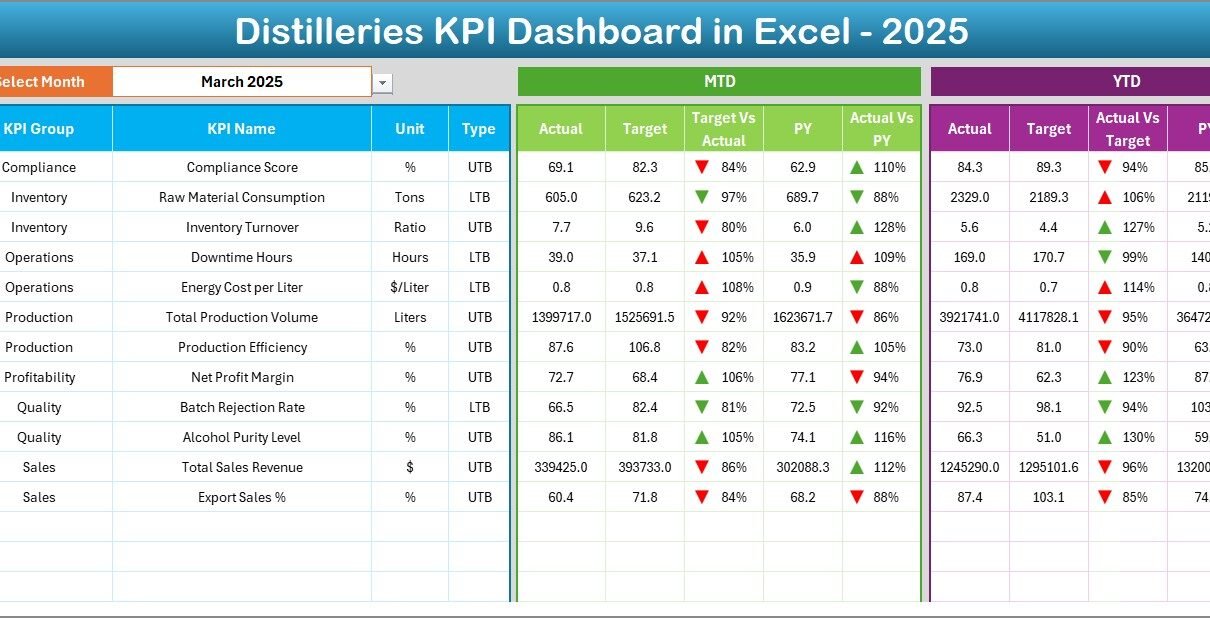
Distilleries KPI Dashboard in Excel

February 19, 2026February 19, 2026 PKComments Off on Distilleries KPI Dashboard in Excel
Running a distillery requires precision, discipline, and strong data control. You monitor fermentation levels, control aging cycles, track bottling efficiency, and manage distribution targets. However, if you track all these
Read More
  • Learn Excel (Free Course)
    • 1. Shortcut Keys
    • 2. Fill & Flash Fill
    • 3. Find & Replace
    • 4. Sort & Filter
    • 5. Formulas & Functions
    • 6. Data Validation
    • 7. Conditional Formatting
    • 8. Basic Charts
    • 9. Advanced Charts
    • 10. Pivot Tables
    • 11. Excel Dashboards
    • 12. VBA Course
    • 13. Excel Formulas with AI
  • Templates
  • Tutorials
    • Charts and Visualization
    • VBA
    • Excel Tips and Tricks
    • Excel Dashboards
    • Power Pivot & DAX
  • Power BI
  • Template Store
    • Ready to Use Templates
  • Courses
  • Academy
    • Excel + AI Mastery: 100 Formulas
    • Excel Pivot Tables & Dashboards
  • About Us
  • Contact Us
Copyright © 2023 PK-AnExcelExpert.com - Privacy Policy