New: NextGenTemplates Academy - video courses on Excel formulas with AI and Pivot Tables & dashboards. Early-bird: 20% off with code EARLYBIRD20 - first 20 orders only. See the courses →
  • Learn Excel (Free Course)
    • 1. Shortcut Keys
    • 2. Fill & Flash Fill
    • 3. Find & Replace
    • 4. Sort & Filter
    • 5. Formulas & Functions
    • 6. Data Validation
    • 7. Conditional Formatting
    • 8. Basic Charts
    • 9. Advanced Charts
    • 10. Pivot Tables
    • 11. Excel Dashboards
    • 12. VBA Course
    • 13. Excel Formulas with AI
  • Templates
  • Tutorials
    • Charts and Visualization
    • VBA
    • Excel Tips and Tricks
    • Excel Dashboards
    • Power Pivot & DAX
  • Power BI
  • Template Store
    • Ready to Use Templates
  • Courses
  • Academy
    • Excel + AI Mastery: 100 Formulas
    • Excel Pivot Tables & Dashboards
  • About Us
  • Contact Us

PK: An Excel Expert

Transforming Data into Decisions

Tag: production monitoring

Dashboard

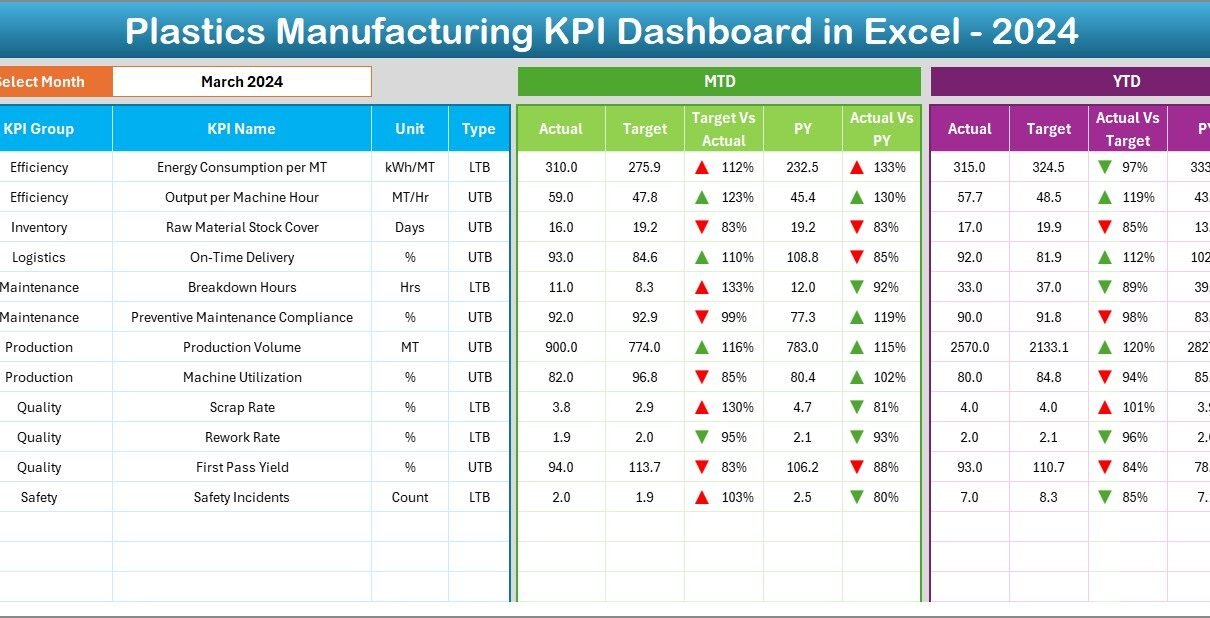
Plastics Manufacturing KPI Dashboard in Excel

December 8, 2025December 8, 2025 PKComments Off on Plastics Manufacturing KPI Dashboard in Excel
Manufacturing teams face continuous pressure to improve performance, reduce waste, and increase production speed. Plastics manufacturing adds even more challenges because quality, machine efficiency, material consumption, and scrap levels change
Read More
Dashboard

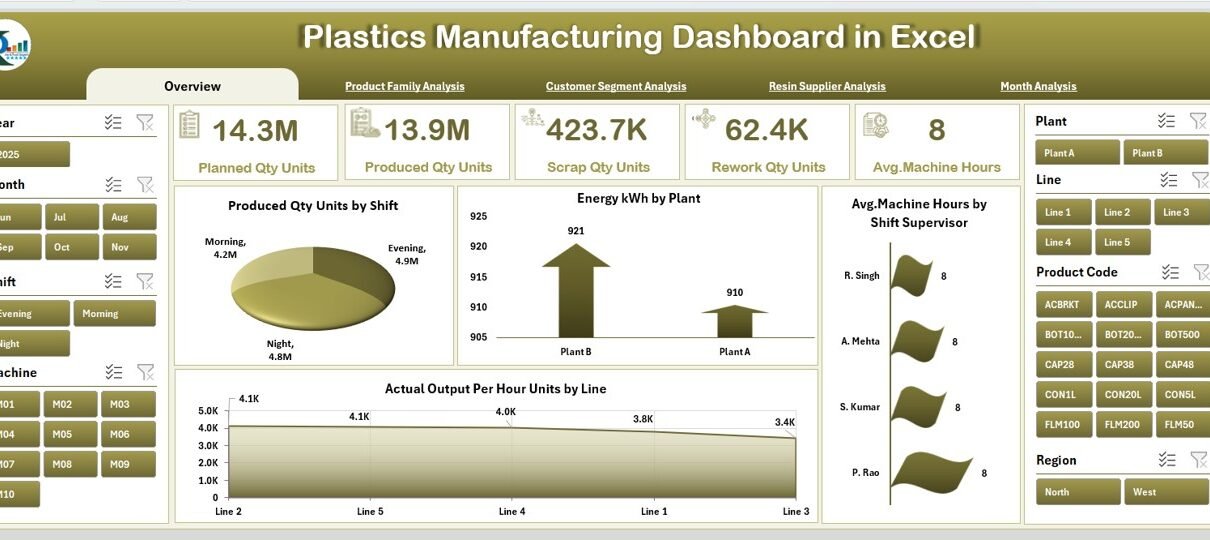
Plastics Manufacturing Dashboard in Excel

December 2, 2025December 2, 2025 PKComments Off on Plastics Manufacturing Dashboard in Excel
Plastics manufacturing plants run fast, complex, and highly repetitive operations every day. Teams must track production output, machine hours, energy usage, rework quantities, scrap, resin performance, shift-wise efficiency, and customer
Read More
Dashboard

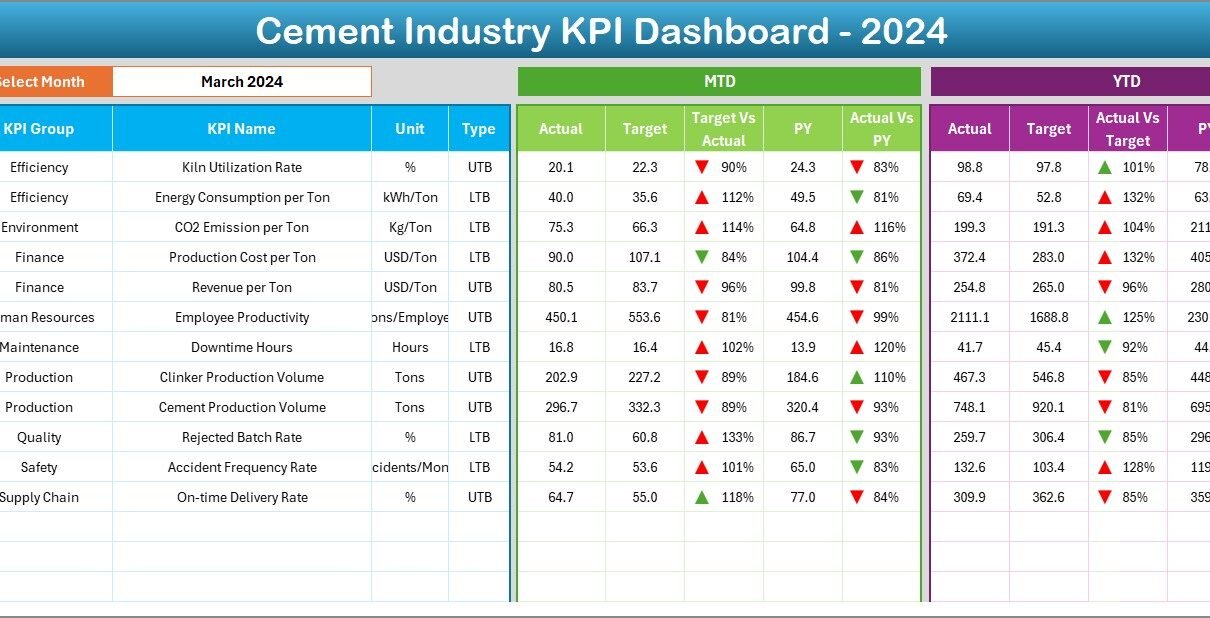
Cement Industry KPI Dashboard in Excel

November 13, 2025November 13, 2025 PKComments Off on Cement Industry KPI Dashboard in Excel
The cement industry plays a major role in infrastructure and economic development. Because of this, cement companies need accurate insights to improve productivity, reduce costs, and boost operational efficiency. However,
Read More
Dashboard

Petroleum Industry KPI Dashboard in Excel

December 4, 2024March 2, 2025 PKComments Off on Petroleum Industry KPI Dashboard in Excel
In the petroleum industry, efficient tracking of key performance indicators (KPIs) is critical for ensuring operational success, managing costs, and optimizing resources. A Petroleum Industry KPI Dashboard provides a centralized
Read More
  • Learn Excel (Free Course)
    • 1. Shortcut Keys
    • 2. Fill & Flash Fill
    • 3. Find & Replace
    • 4. Sort & Filter
    • 5. Formulas & Functions
    • 6. Data Validation
    • 7. Conditional Formatting
    • 8. Basic Charts
    • 9. Advanced Charts
    • 10. Pivot Tables
    • 11. Excel Dashboards
    • 12. VBA Course
    • 13. Excel Formulas with AI
  • Templates
  • Tutorials
    • Charts and Visualization
    • VBA
    • Excel Tips and Tricks
    • Excel Dashboards
    • Power Pivot & DAX
  • Power BI
  • Template Store
    • Ready to Use Templates
  • Courses
  • Academy
    • Excel + AI Mastery: 100 Formulas
    • Excel Pivot Tables & Dashboards
  • About Us
  • Contact Us
Copyright © 2023 PK-AnExcelExpert.com - Privacy Policy