New: NextGenTemplates Academy - video courses on Excel formulas with AI and Pivot Tables & dashboards. Early-bird: 20% off with code EARLYBIRD20 - first 20 orders only. See the courses →
  • Learn Excel (Free Course)
    • 1. Shortcut Keys
    • 2. Fill & Flash Fill
    • 3. Find & Replace
    • 4. Sort & Filter
    • 5. Formulas & Functions
    • 6. Data Validation
    • 7. Conditional Formatting
    • 8. Basic Charts
    • 9. Advanced Charts
    • 10. Pivot Tables
    • 11. Excel Dashboards
    • 12. VBA Course
    • 13. Excel Formulas with AI
  • Templates
  • Tutorials
    • Charts and Visualization
    • VBA
    • Excel Tips and Tricks
    • Excel Dashboards
    • Power Pivot & DAX
  • Power BI
  • Template Store
    • Ready to Use Templates
  • Courses
  • Academy
    • Excel + AI Mastery: 100 Formulas
    • Excel Pivot Tables & Dashboards
  • About Us
  • Contact Us

PK: An Excel Expert

Transforming Data into Decisions

Tag: Profit Analysis Dashboard

Dashboard Power BI

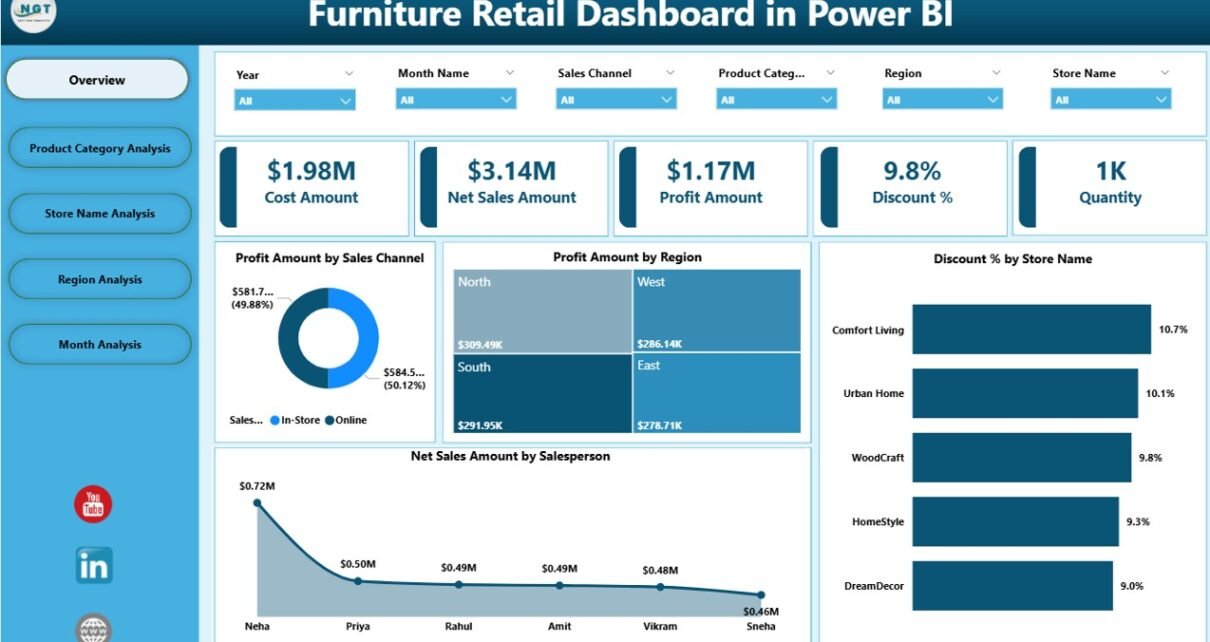
Furniture Retail Dashboard in Power BI

January 28, 2026January 28, 2026 PKComments Off on Furniture Retail Dashboard in Power BI
Furniture retail is a competitive and data-driven business. Every day, retailers track sales, discounts, profits, stores, regions, and product categories. However, when this data sits in multiple files or static
Read More
Dashboard Power BI

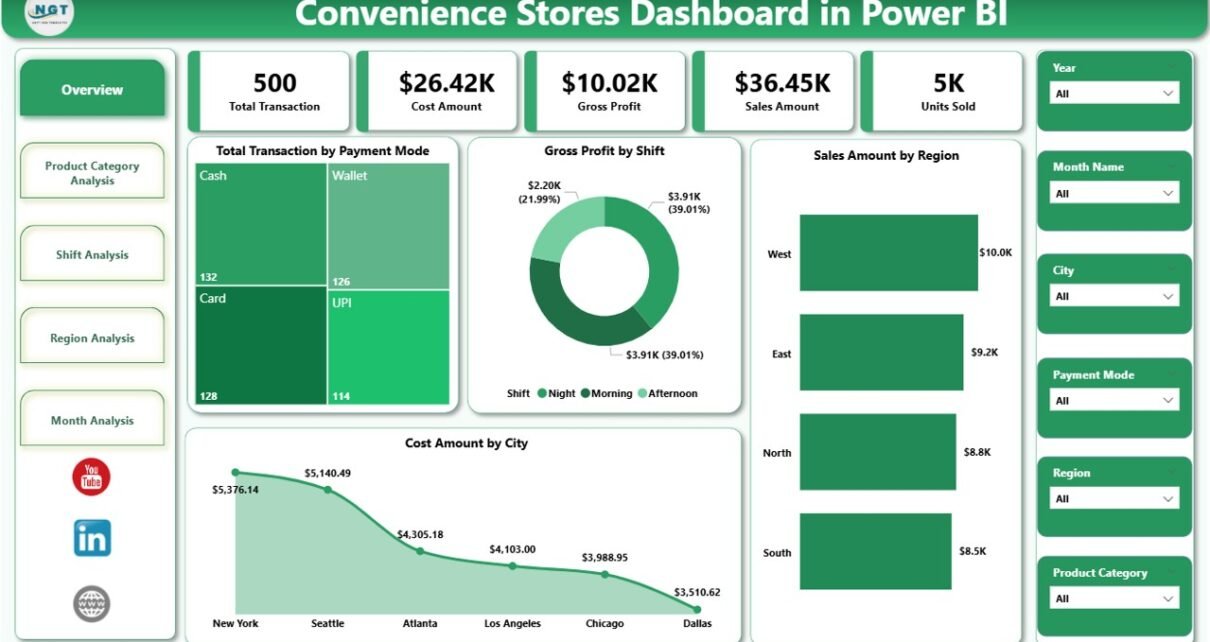
Convenience Stores Dashboard in Power BI

January 28, 2026January 28, 2026 PKComments Off on Convenience Stores Dashboard in Power BI
Running a convenience store looks simple from the outside. However, in reality, it involves managing thousands of transactions, multiple product categories, different shifts, varied payment modes, and regional performance differences—every
Read More
Dashboard Power BI

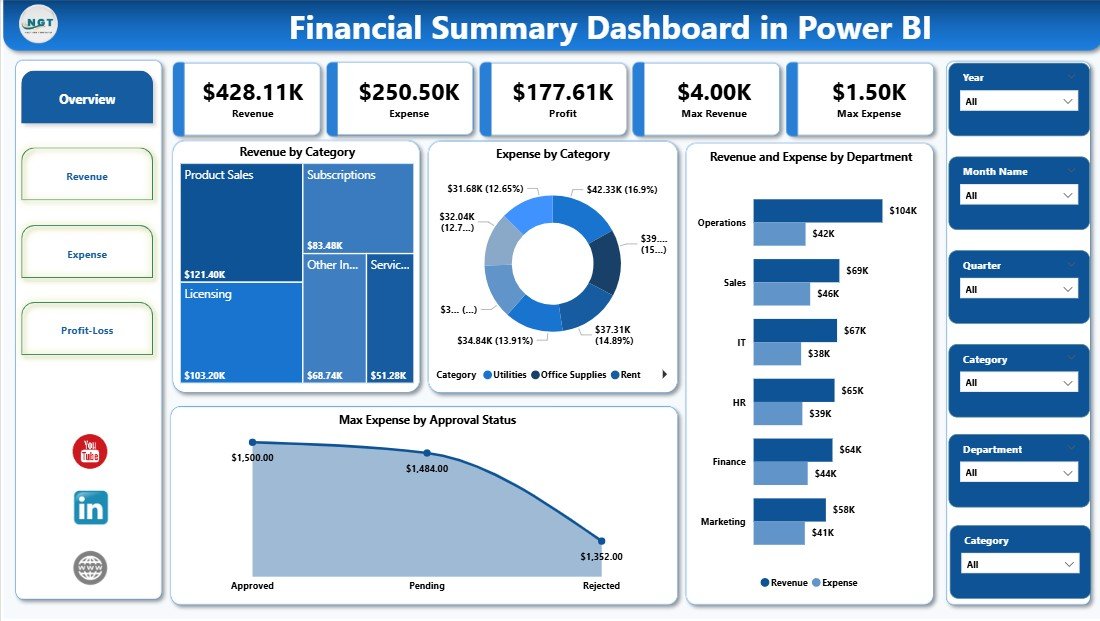
Financial Summary Dashboard in Power BI

January 12, 2026January 12, 2026 PKComments Off on Financial Summary Dashboard in Power BI
Managing finances without clear visibility always creates confusion. Many organizations track revenue, expenses, and profit in separate Excel files. As a result, leaders struggle to understand the complete financial picture.
Read More
Dashboard Power BI

Electricity Tender Dashboard in Power BI

December 23, 2025December 23, 2025 PKComments Off on Electricity Tender Dashboard in Power BI
Managing electricity tenders demands accuracy, speed, and transparency. However, many organizations still depend on scattered Excel files, manual summaries, and static reports. As a result, decision-making becomes slow, errors increase,
Read More
Dashboard Power BI

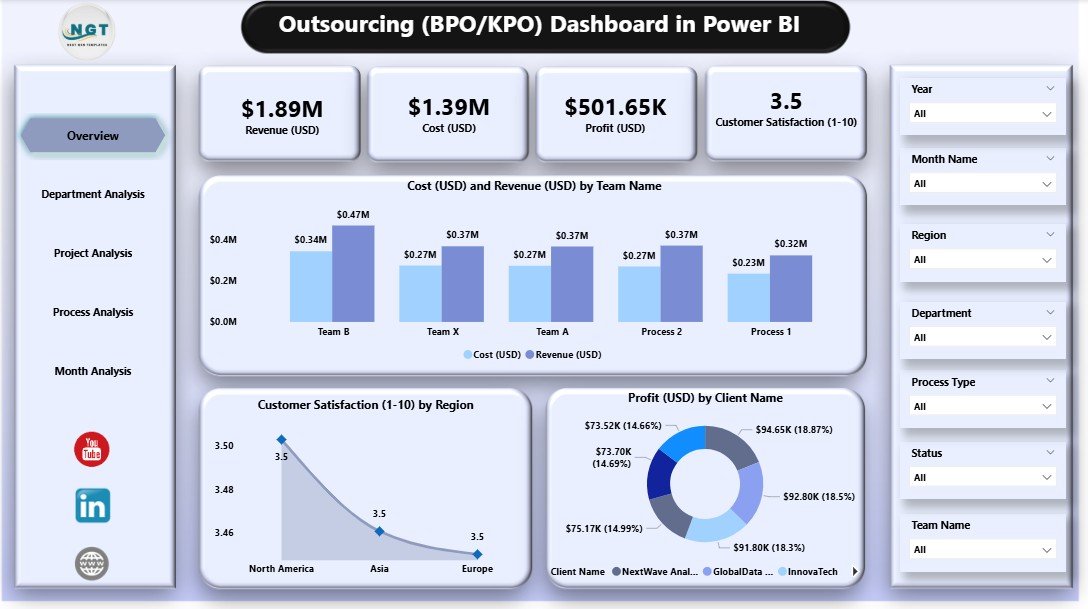
Outsourcing (BPO KPO) Dashboard in Power BI

November 16, 2025November 16, 2025 PKComments Off on Outsourcing (BPO KPO) Dashboard in Power BI
The outsourcing industry grows every year because companies want to save time, reduce costs, and improve efficiency. Business Process Outsourcing (BPO) and Knowledge Process Outsourcing (KPO) help organizations handle customer
Read More
  • Learn Excel (Free Course)
    • 1. Shortcut Keys
    • 2. Fill & Flash Fill
    • 3. Find & Replace
    • 4. Sort & Filter
    • 5. Formulas & Functions
    • 6. Data Validation
    • 7. Conditional Formatting
    • 8. Basic Charts
    • 9. Advanced Charts
    • 10. Pivot Tables
    • 11. Excel Dashboards
    • 12. VBA Course
    • 13. Excel Formulas with AI
  • Templates
  • Tutorials
    • Charts and Visualization
    • VBA
    • Excel Tips and Tricks
    • Excel Dashboards
    • Power Pivot & DAX
  • Power BI
  • Template Store
    • Ready to Use Templates
  • Courses
  • Academy
    • Excel + AI Mastery: 100 Formulas
    • Excel Pivot Tables & Dashboards
  • About Us
  • Contact Us
Copyright © 2023 PK-AnExcelExpert.com - Privacy Policy