New: NextGenTemplates Academy - video courses on Excel formulas with AI and Pivot Tables & dashboards. Early-bird: 20% off with code EARLYBIRD20 - first 20 orders only. See the courses →
  • Learn Excel (Free Course)
    • 1. Shortcut Keys
    • 2. Fill & Flash Fill
    • 3. Find & Replace
    • 4. Sort & Filter
    • 5. Formulas & Functions
    • 6. Data Validation
    • 7. Conditional Formatting
    • 8. Basic Charts
    • 9. Advanced Charts
    • 10. Pivot Tables
    • 11. Excel Dashboards
    • 12. VBA Course
    • 13. Excel Formulas with AI
  • Templates
  • Tutorials
    • Charts and Visualization
    • VBA
    • Excel Tips and Tricks
    • Excel Dashboards
    • Power Pivot & DAX
  • Power BI
  • Template Store
    • Ready to Use Templates
  • Courses
  • Academy
    • Excel + AI Mastery: 100 Formulas
    • Excel Pivot Tables & Dashboards
  • About Us
  • Contact Us

PK: An Excel Expert

Transforming Data into Decisions

Tag: R&D dashboard

Dashboard Power BI

Research and Development Dashboard in Power BI

February 20, 2026February 20, 2026 PKComments Off on Research and Development Dashboard in Power BI
In today’s innovation-driven business environment, companies must manage research projects with precision and speed. However, many organizations still struggle with scattered reports, delayed insights, and poor visibility into R&D performance.
Read More
Templates

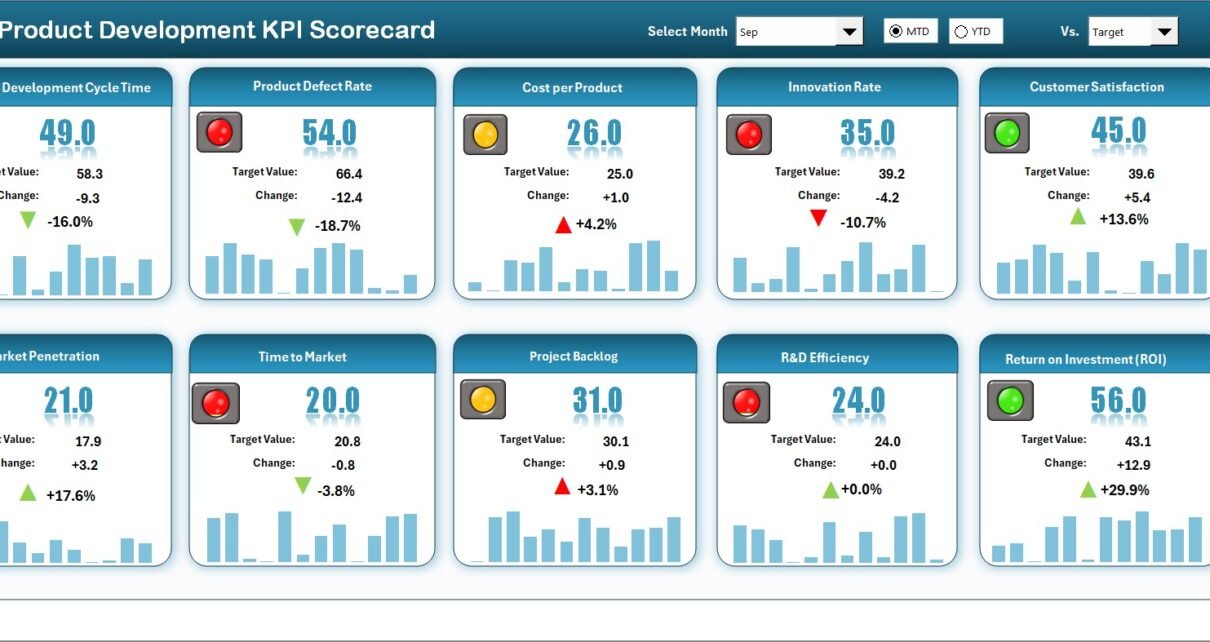
Product Development KPI Scorecard in Excel

February 19, 2026February 19, 2026 PKComments Off on Product Development KPI Scorecard in Excel
Product development drives growth. However, without proper measurement, even great ideas can fail to deliver results. Many teams focus heavily on innovation but struggle to track timelines, efficiency, and success
Read More
Dashboard Power BI

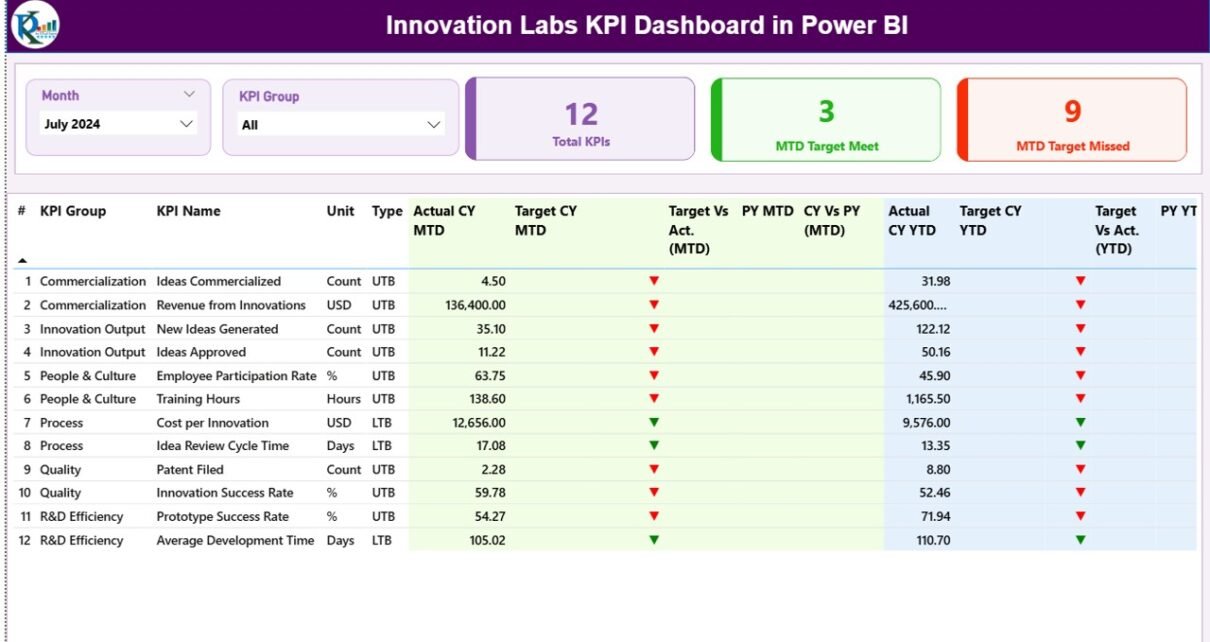
Innovation Labs KPI Dashboard in Power BI

January 29, 2026January 29, 2026 PKComments Off on Innovation Labs KPI Dashboard in Power BI
Innovation labs play a critical role in shaping the future of organizations. They experiment, test ideas, build prototypes, and convert creativity into measurable business value. However, innovation without measurement quickly
Read More
Dashboard Power BI

Electronics & Semiconductors Dashboard in Power BI

November 16, 2025November 16, 2025 PKComments Off on Electronics & Semiconductors Dashboard in Power BI
The electronics and semiconductor industry grows fast. Every day, companies handle thousands of data points related to costs, production, energy usage, and revenue. Because the industry moves at high speed,
Read More
Dashboard Power BI

Biotechnology Dashboard in Power BI

October 10, 2025October 10, 2025 PKComments Off on Biotechnology Dashboard in Power BI
The biotechnology industry is one of the most data-driven sectors in the world. From clinical trials and research development to regulatory filings and production costs, every decision depends on accurate
Read More
  • Learn Excel (Free Course)
    • 1. Shortcut Keys
    • 2. Fill & Flash Fill
    • 3. Find & Replace
    • 4. Sort & Filter
    • 5. Formulas & Functions
    • 6. Data Validation
    • 7. Conditional Formatting
    • 8. Basic Charts
    • 9. Advanced Charts
    • 10. Pivot Tables
    • 11. Excel Dashboards
    • 12. VBA Course
    • 13. Excel Formulas with AI
  • Templates
  • Tutorials
    • Charts and Visualization
    • VBA
    • Excel Tips and Tricks
    • Excel Dashboards
    • Power Pivot & DAX
  • Power BI
  • Template Store
    • Ready to Use Templates
  • Courses
  • Academy
    • Excel + AI Mastery: 100 Formulas
    • Excel Pivot Tables & Dashboards
  • About Us
  • Contact Us
Copyright © 2023 PK-AnExcelExpert.com - Privacy Policy