New: NextGenTemplates Academy - video courses on Excel formulas with AI and Pivot Tables & dashboards. Early-bird: 20% off with code EARLYBIRD20 - first 20 orders only. See the courses →
  • Learn Excel (Free Course)
    • 1. Shortcut Keys
    • 2. Fill & Flash Fill
    • 3. Find & Replace
    • 4. Sort & Filter
    • 5. Formulas & Functions
    • 6. Data Validation
    • 7. Conditional Formatting
    • 8. Basic Charts
    • 9. Advanced Charts
    • 10. Pivot Tables
    • 11. Excel Dashboards
    • 12. VBA Course
    • 13. Excel Formulas with AI
  • Templates
  • Tutorials
    • Charts and Visualization
    • VBA
    • Excel Tips and Tricks
    • Excel Dashboards
    • Power Pivot & DAX
  • Power BI
  • Template Store
    • Ready to Use Templates
  • Courses
  • Academy
    • Excel + AI Mastery: 100 Formulas
    • Excel Pivot Tables & Dashboards
  • About Us
  • Contact Us

PK: An Excel Expert

Transforming Data into Decisions

Tag: Real Estate Development Dashboard

Dashboard Power BI

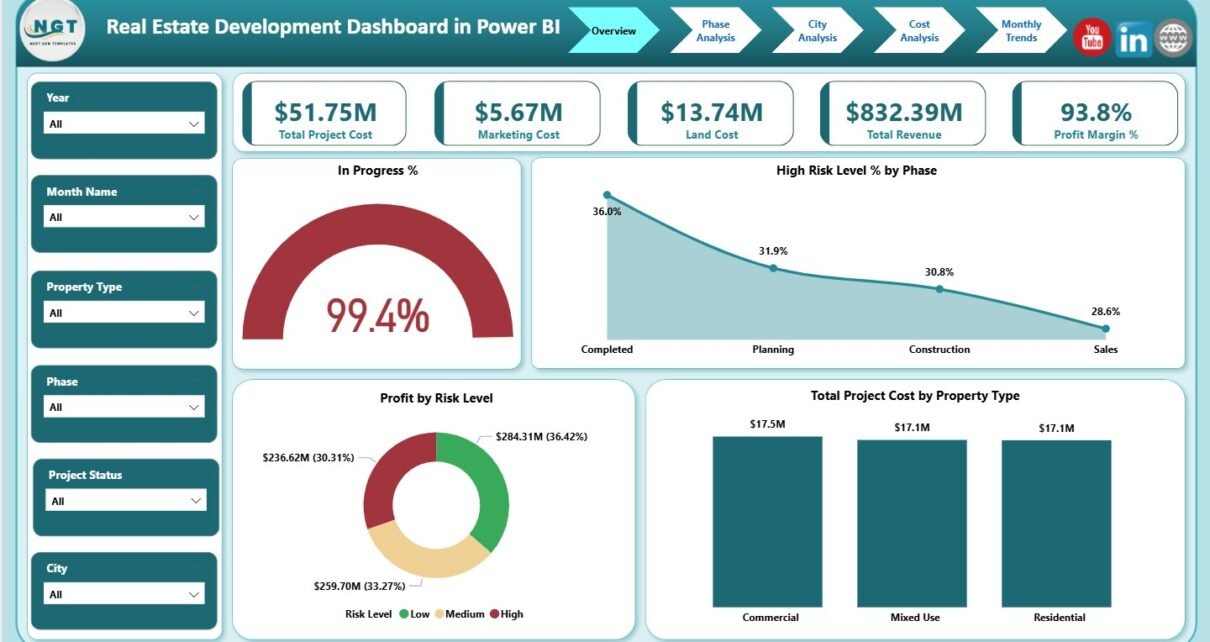
Real Estate Development Dashboard in Power BI

January 15, 2026January 15, 2026 PKComments Off on Real Estate Development Dashboard in Power BI
Real estate development involves high capital investment, long project cycles, and multiple risk factors. Therefore, developers, investors, and project managers must track cost, revenue, progress, and profitability with absolute clarity.
Read More
Dashboard

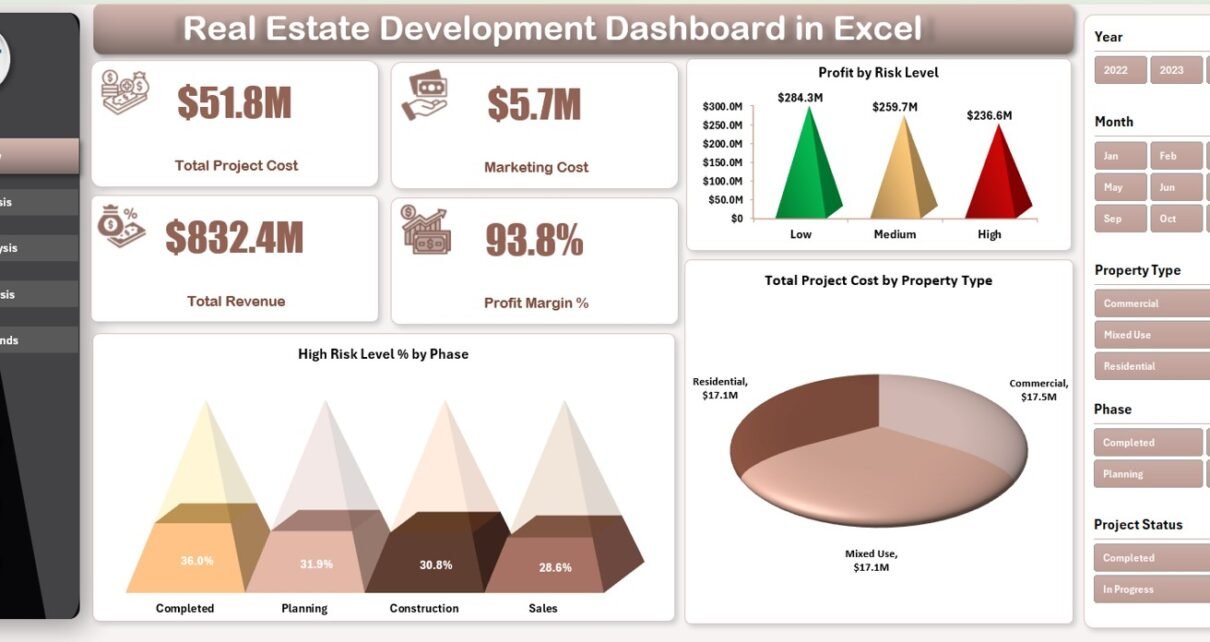
Real Estate Development Dashboard in Excel

January 14, 2026January 14, 2026 PKComments Off on Real Estate Development Dashboard in Excel
Real estate development involves high capital investment, long project timelines, and multiple risk factors. Developers, project managers, and investors must continuously track project costs, revenues, phases, risks, and profitability. However,
Read More
Dashboard

Real Estate Development KPI Dashboard in Excel

September 24, 2025September 24, 2025 PKComments Off on Real Estate Development KPI Dashboard in Excel
Managing real estate development projects is a complex task that requires continuous tracking of costs, timelines, and performance. Without proper monitoring, delays, cost overruns, and inefficiencies can significantly impact profits.
Read More
  • Learn Excel (Free Course)
    • 1. Shortcut Keys
    • 2. Fill & Flash Fill
    • 3. Find & Replace
    • 4. Sort & Filter
    • 5. Formulas & Functions
    • 6. Data Validation
    • 7. Conditional Formatting
    • 8. Basic Charts
    • 9. Advanced Charts
    • 10. Pivot Tables
    • 11. Excel Dashboards
    • 12. VBA Course
    • 13. Excel Formulas with AI
  • Templates
  • Tutorials
    • Charts and Visualization
    • VBA
    • Excel Tips and Tricks
    • Excel Dashboards
    • Power Pivot & DAX
  • Power BI
  • Template Store
    • Ready to Use Templates
  • Courses
  • Academy
    • Excel + AI Mastery: 100 Formulas
    • Excel Pivot Tables & Dashboards
  • About Us
  • Contact Us
Copyright © 2023 PK-AnExcelExpert.com - Privacy Policy