New: NextGenTemplates Academy - video courses on Excel formulas with AI and Pivot Tables & dashboards. Early-bird: 20% off with code EARLYBIRD20 - first 20 orders only. See the courses →
  • Learn Excel (Free Course)
    • 1. Shortcut Keys
    • 2. Fill & Flash Fill
    • 3. Find & Replace
    • 4. Sort & Filter
    • 5. Formulas & Functions
    • 6. Data Validation
    • 7. Conditional Formatting
    • 8. Basic Charts
    • 9. Advanced Charts
    • 10. Pivot Tables
    • 11. Excel Dashboards
    • 12. VBA Course
    • 13. Excel Formulas with AI
  • Templates
  • Tutorials
    • Charts and Visualization
    • VBA
    • Excel Tips and Tricks
    • Excel Dashboards
    • Power Pivot & DAX
  • Power BI
  • Template Store
    • Ready to Use Templates
  • Courses
  • Academy
    • Excel + AI Mastery: 100 Formulas
    • Excel Pivot Tables & Dashboards
  • About Us
  • Contact Us

PK: An Excel Expert

Transforming Data into Decisions

Tag: Refinery Analytics

Dashboard Power BI

Refinery Dashboard in Power BI

January 3, 2026January 3, 2026 PKComments Off on Refinery Dashboard in Power BI
Managing a refinery involves thousands of daily decisions. Leaders must control costs, reduce downtime, optimize energy usage, and increase output at the same time. However, when teams rely on scattered
Read More
Dashboard

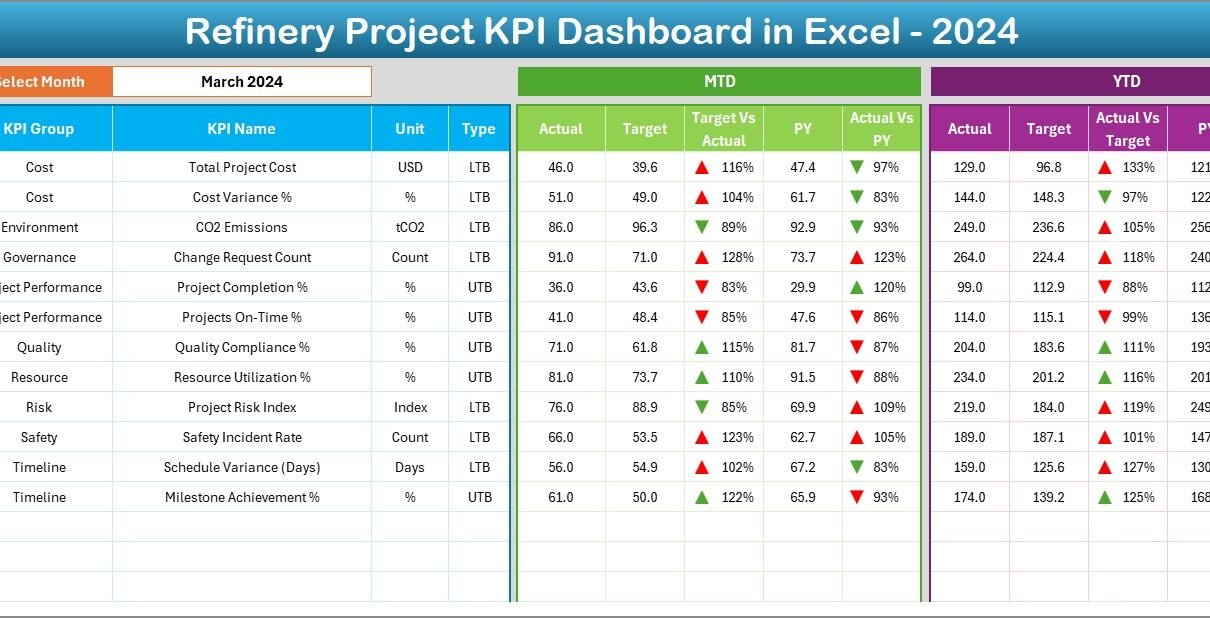
Refinery Project KPI Dashboard in Excel

December 27, 2025December 27, 2025 PKComments Off on Refinery Project KPI Dashboard in Excel
Managing refinery projects always demands precision, visibility, and timely decision-making. Because refinery projects involve large budgets, strict timelines, safety standards, and multiple stakeholders, even a small deviation can lead to
Read More
Dashboard Power BI

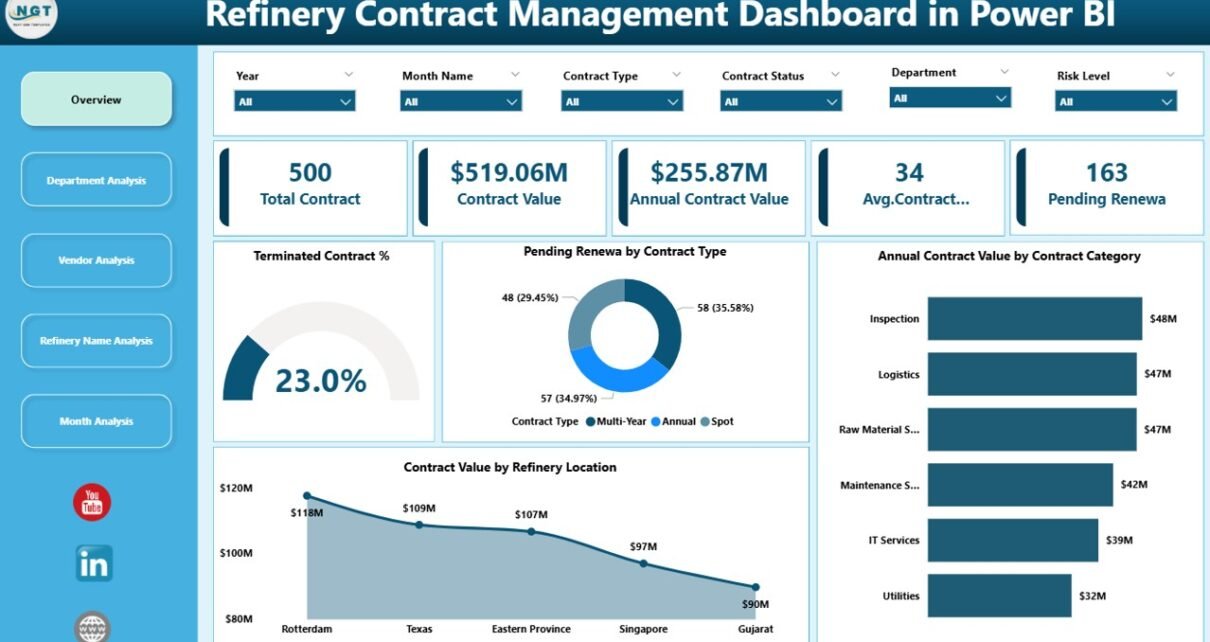
Refinery Contract Management Dashboard in Power BI

December 26, 2025December 26, 2025 PKComments Off on Refinery Contract Management Dashboard in Power BI
Managing refinery contracts is never simple. In fact, refinery operations involve high-value agreements, long-term vendor relationships, strict compliance requirements, and continuous monitoring of renewals, values, and risks. Therefore, when organizations
Read More
Dashboard Power BI

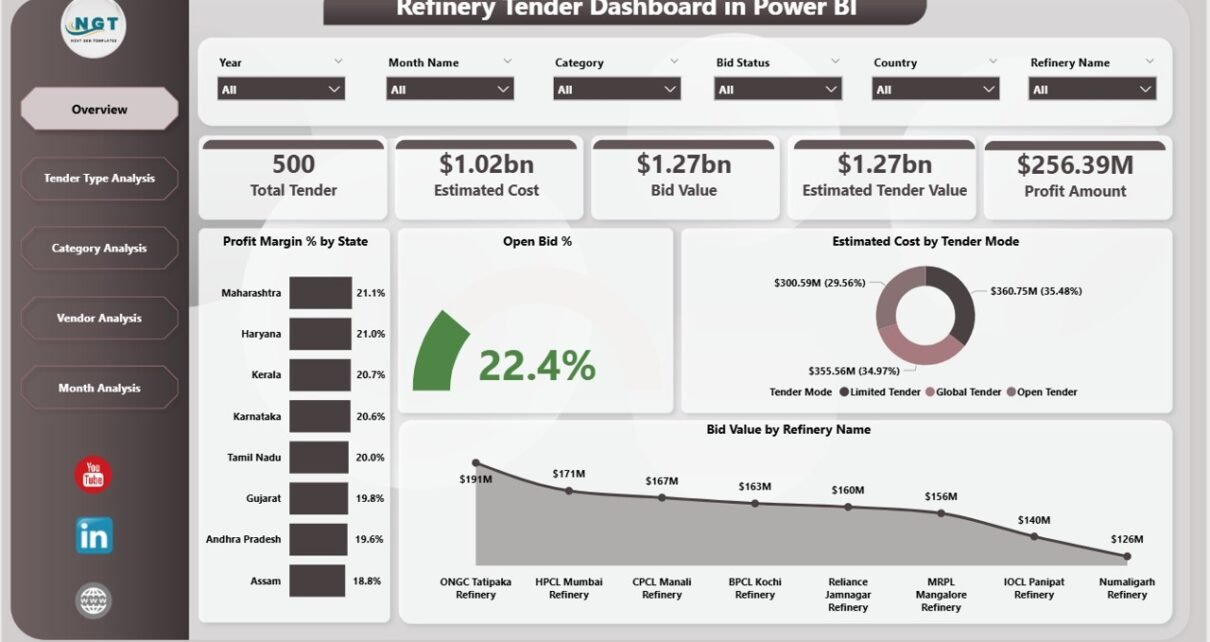
Refinery Tender Dashboard in Power BI

December 26, 2025December 26, 2025 PKComments Off on Refinery Tender Dashboard in Power BI
Managing refinery tenders demands precision, transparency, and continuous monitoring. However, many refinery organizations still depend on scattered Excel files, emails, and manual reports. As a result, decision-makers struggle to track
Read More
Dashboard

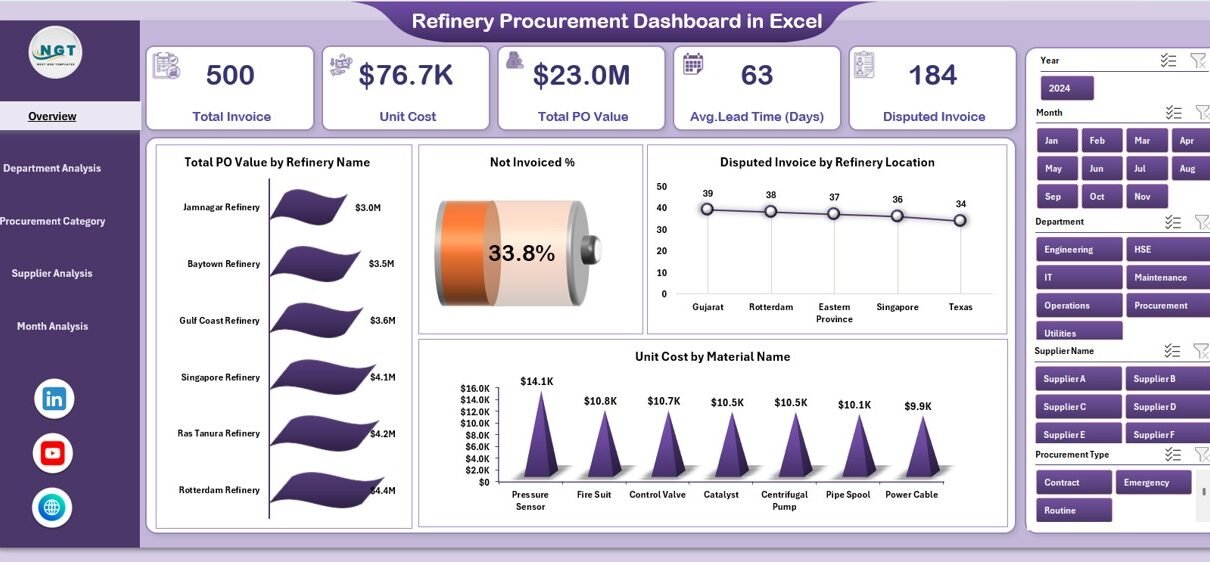
Refinery Procurement Dashboard in Excel

December 25, 2025December 25, 2025 PKComments Off on Refinery Procurement Dashboard in Excel
Managing procurement operations in a refinery is never simple. Refineries deal with large volumes of raw materials, multiple suppliers, strict quality standards, and tight delivery timelines. Because of this, even
Read More
  • Learn Excel (Free Course)
    • 1. Shortcut Keys
    • 2. Fill & Flash Fill
    • 3. Find & Replace
    • 4. Sort & Filter
    • 5. Formulas & Functions
    • 6. Data Validation
    • 7. Conditional Formatting
    • 8. Basic Charts
    • 9. Advanced Charts
    • 10. Pivot Tables
    • 11. Excel Dashboards
    • 12. VBA Course
    • 13. Excel Formulas with AI
  • Templates
  • Tutorials
    • Charts and Visualization
    • VBA
    • Excel Tips and Tricks
    • Excel Dashboards
    • Power Pivot & DAX
  • Power BI
  • Template Store
    • Ready to Use Templates
  • Courses
  • Academy
    • Excel + AI Mastery: 100 Formulas
    • Excel Pivot Tables & Dashboards
  • About Us
  • Contact Us
Copyright © 2023 PK-AnExcelExpert.com - Privacy Policy