New: NextGenTemplates Academy - video courses on Excel formulas with AI and Pivot Tables & dashboards. Early-bird: 20% off with code EARLYBIRD20 - first 20 orders only. See the courses →
  • Learn Excel (Free Course)
    • 1. Shortcut Keys
    • 2. Fill & Flash Fill
    • 3. Find & Replace
    • 4. Sort & Filter
    • 5. Formulas & Functions
    • 6. Data Validation
    • 7. Conditional Formatting
    • 8. Basic Charts
    • 9. Advanced Charts
    • 10. Pivot Tables
    • 11. Excel Dashboards
    • 12. VBA Course
    • 13. Excel Formulas with AI
  • Templates
  • Tutorials
    • Charts and Visualization
    • VBA
    • Excel Tips and Tricks
    • Excel Dashboards
    • Power Pivot & DAX
  • Power BI
  • Template Store
    • Ready to Use Templates
  • Courses
  • Academy
    • Excel + AI Mastery: 100 Formulas
    • Excel Pivot Tables & Dashboards
  • About Us
  • Contact Us

PK: An Excel Expert

Transforming Data into Decisions

Tag: Refinery KPI Dashboard

Dashboard

Refinery Dashboard in Excel

January 3, 2026January 3, 2026 PKComments Off on Refinery Dashboard in Excel
Managing refinery operations requires precision, clarity, and timely decision-making. However, when data stays scattered across multiple spreadsheets and reports, performance tracking becomes slow and reactive. Therefore, organizations increasingly rely on
Read More
Dashboard Power BI

Refinery Procurement KPI Dashboard in Power BI

December 30, 2025December 30, 2025 PKComments Off on Refinery Procurement KPI Dashboard in Power BI
A Refinery Procurement KPI Dashboard in Power BI is a ready-to-use, interactive analytics solution designed to track, measure, and analyze procurement performance inside oil and gas refineries. Instead of managing
Read More
Dashboard Power BI

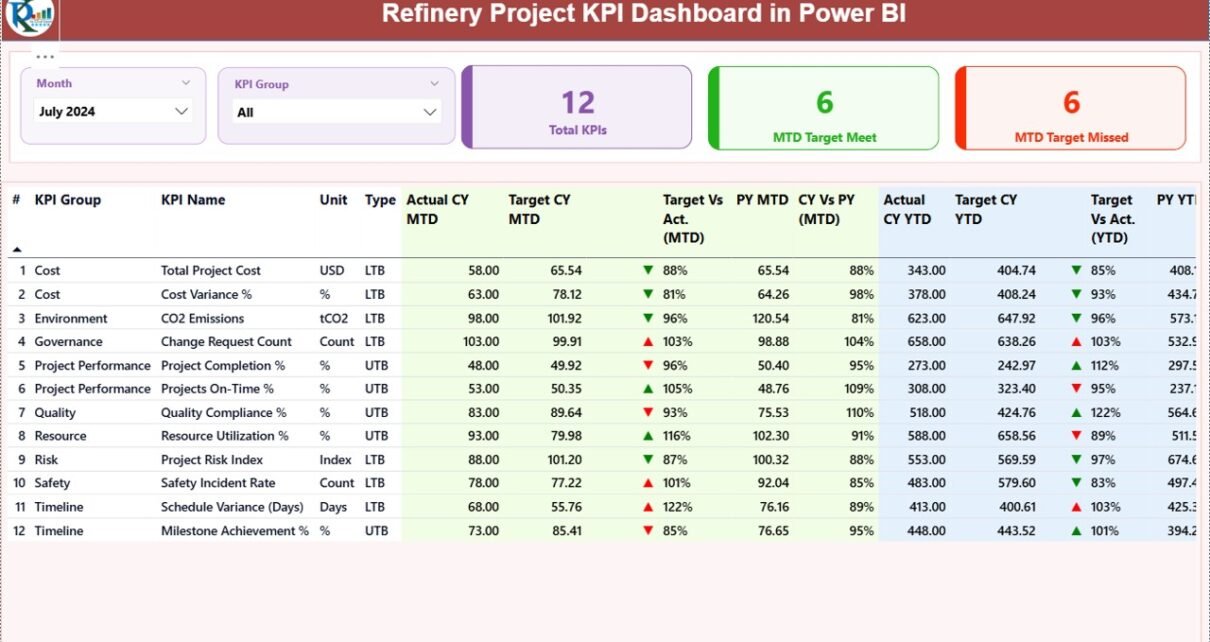
Refinery Project KPI Dashboard in Power BI

December 28, 2025October 10, 2026 PKComments Off on Refinery Project KPI Dashboard in Power BI
Modern refinery projects are complex, capital-intensive, and time-sensitive. Therefore, project managers, engineering teams, and leadership groups must track performance accurately at every stage. However, when teams rely on scattered Excel
Read More
Dashboard

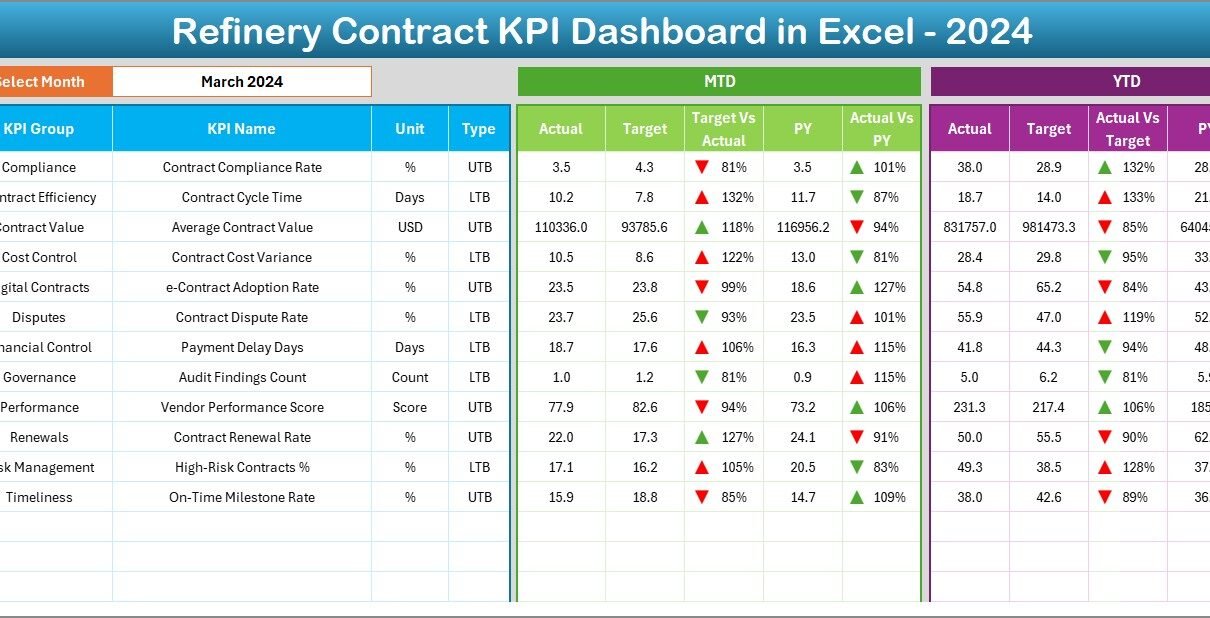
Refinery Contract KPI Dashboard in Excel

December 27, 2025December 27, 2025 PKComments Off on Refinery Contract KPI Dashboard in Excel
Managing contracts in the refinery industry demands accuracy, consistency, and continuous monitoring. Because refinery contracts involve high values, long durations, strict compliance requirements, and multiple stakeholders, even a small deviation
Read More
  • Learn Excel (Free Course)
    • 1. Shortcut Keys
    • 2. Fill & Flash Fill
    • 3. Find & Replace
    • 4. Sort & Filter
    • 5. Formulas & Functions
    • 6. Data Validation
    • 7. Conditional Formatting
    • 8. Basic Charts
    • 9. Advanced Charts
    • 10. Pivot Tables
    • 11. Excel Dashboards
    • 12. VBA Course
    • 13. Excel Formulas with AI
  • Templates
  • Tutorials
    • Charts and Visualization
    • VBA
    • Excel Tips and Tricks
    • Excel Dashboards
    • Power Pivot & DAX
  • Power BI
  • Template Store
    • Ready to Use Templates
  • Courses
  • Academy
    • Excel + AI Mastery: 100 Formulas
    • Excel Pivot Tables & Dashboards
  • About Us
  • Contact Us
Copyright © 2023 PK-AnExcelExpert.com - Privacy Policy